The Crucial P1 1TB SSD Review: The Other Consumer QLC SSD
by Billy Tallis on November 8, 2018 9:00 AM ESTBAPCo SYSmark 2018
BAPCo's SYSmark 2018 is an application-based benchmark that uses real-world applications to replay usage patterns of business users, with subscores for productivity, creativity and responsiveness. Scores represnt overall system performance and are calibrated against a reference system that is defined to score 1000 in each of the scenarios. A score of, say, 2000, would imply that the system under test is twice as fast as the reference system.
SYSmark scores are based on total application response time as seen by the user, including not only storage latency but time spent by the processor. This means there's a limit to how much a storage improvement could possibly increase scores, because the SSD is only in use for a small fraction of the total test duration. This is a significant difference from our ATSB tests where only the storage portion of the workload is replicated and disk idle times are cut short to a maximum of 25ms.
| AnandTech SYSmark SSD Testbed | |
| CPU | Intel Core i5-7400 |
| Motherboard | ASUS PRIME Z270-A |
| Chipset | Intel Z270 |
| Memory | 2x 8GB Corsair Vengeance DDR4-2400 CL17 |
| Case | In Win C583 |
| Power Supply | Cooler Master G550M |
| OS | Windows 10 64-bit, version 1803 |
Our SSD testing with SYSmark uses a different test system than the rest of our SSD tests. This machine is set up to measure total system power consumption rather than just the drive's power. The test is run five times in a row on each hardware configuration, and the average scores are reported below.
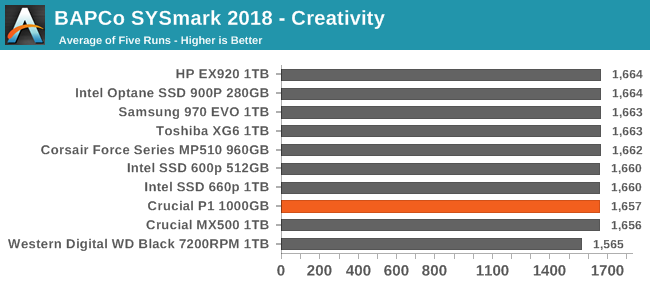
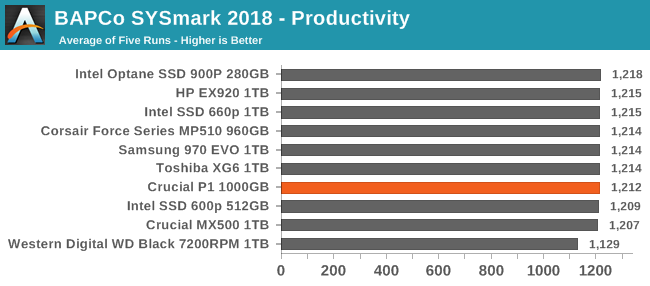
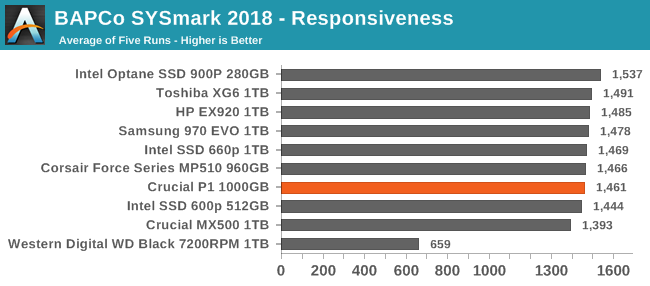
The creativity and productivity scenarios are relatively unaffected by storage performance, and depend much more on compute power. The responsiveness scores are more dependent on storage performance, but even so the differences between SSDs are fairly small. The Crucial P1 is outperforms the MX500 SATA drive but is a bit slower than the high-end NVMe drives.
Energy Usage
The SYSmark energy usage scores measure total system power consumption, excluding the display. Our SYSmark test system idles at around 26 W and peaks at over 60 W measured at the wall during the benchmark run. SATA SSDs seldom exceed 5 W and idle at a fraction of a watt, and the SSDs spend most of the test idle. This means the energy usage scores will inevitably be very close. A typical notebook system will tend to be better optimized for power efficiency than this desktop system, so the SSD would account for a much larger portion of the total and the score difference between SSDs would be more noticeable.
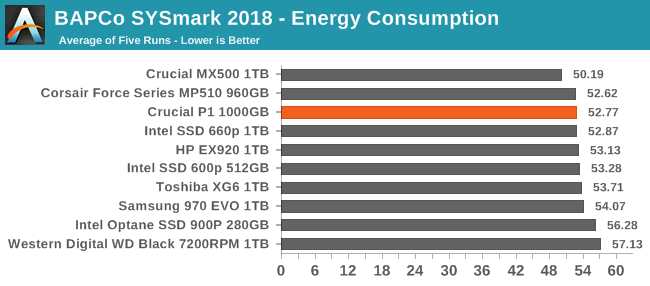
The energy consumption scores for the SSDs reflect the general trend that higher performance comes with the cost of worse power efficiency. SATA SSDs still lead the rankings for most efficient drive, and the hard drive that's included for comparison purposes required more energy than even the power-hungry Intel Optane SSD 900P.


66 Comments
View All Comments
Marlin1975 - Thursday, November 8, 2018 - link
" The company's first attempt at an NVMe drive was ready to hit the market but was canceled when it became clear that it would not have been competitive."Looking at this one maybe it should follow the same fate. Or the price should be much lower.
StrangerGuy - Thursday, November 8, 2018 - link
The MSRP for the 1TB is a completely non starter when the excellent EX920 1TB already hit $170, but if the actual price drops to $120 it's definitely appealing especially for a low write count usage like a Steam install drive.FullmetalTitan - Thursday, November 8, 2018 - link
The 970 EVO 1TB NVMe was just on sale for $228 on most retail sites in the US. At the same cost/GB and significantly better performance, it isn't even a question what to buy currently.menting - Thursday, November 8, 2018 - link
comparing sale price vs retail price is pretty meaningless.Billy Tallis - Thursday, November 8, 2018 - link
Given how flash memory prices have been dropping, today's sale price is next month's everyday retail price.DigitalFreak - Friday, November 9, 2018 - link
Just saw the 970 EVO 1TB is $219 at Microcenter. Unless it gets a $50+ price cut immediately, the P1 is DOA.tokyojerry - Friday, April 19, 2019 - link
Currently $128 at Amazon. As of 4/19/2019 3:14:42 PM0ldman79 - Monday, November 12, 2018 - link
I just paid $139 for a WD Blue 1TB 3D m.2 a couple of days ago. Haven't even beaten on it thoroughly.In quick testing (video encoding) during the decompress it will sustain 300MBps for a while, not sure if I'm hitting a drive limit, IO limit or CPU limit shortly there after. The program starts a few other processes, so I'm thinking CPU.
III-V - Thursday, November 8, 2018 - link
They are supposedly having yield issues. If they resolve those, there is plenty of room for cost to come down.Oxford Guy - Thursday, November 8, 2018 - link
Look at what happens with DRAM every time. DDR2 comes out and DDR1 becomes more expensive. Rinse repeat.QLC may lead to higher TLC prices, if TLC volume goes down and/or gets positioned as a more premium product as manufacturers try to sell us QLC.