Enterprise SATA SSDs: Can Budget 2020 beat Top Line 2017?
by Billy Tallis on February 4, 2020 11:00 AM ESTPeak Throughput
For client/consumer SSDs we primarily focus on low queue depth performance for its relevance to interactive workloads. Server workloads are often intense enough to keep a pile of drives busy, so the maximum attainable throughput of enterprise SSDs is actually important. But it usually isn't a good idea to focus solely on throughput while ignoring latency, because somewhere down the line there's always an end user waiting for the server to respond.
In order to characterize the maximum throughput an SSD can reach, we need to test at a range of queue depths. Different drives will reach their full speed at different queue depths, and increasing the queue depth beyond that saturation point may be slightly detrimental to throughput, and will drastically and unnecessarily increase latency. Because of that, we are not going to compare drives at a single fixed queue depth. Instead, each drive was tested at a range of queue depths up to the excessively high QD 512. (SATA drives are limited to QD32, but we're also using this test suite for NVMe drives.) For each drive, the queue depth with the highest performance was identified. Rather than report that value, we're reporting the throughput, latency, and power efficiency for the lowest queue depth that provides at least 95% of the highest obtainable performance. This often yields much more reasonable latency numbers, and is representative of how a reasonable operating system's IO scheduler should behave. (Our tests have to be run with any such scheduler disabled, or we would not get the queue depths we ask for.)
Unlike last year's enterprise SSD reviews, we're now using the new io asynchronous IO APIs on Linux instead of the simpler synchronous APIs that limit software to one outstanding IO per thread. This means we can hit high queue depths without loading down the system with more threads than we have physical CPU cores, and that leads to much better latency metrics—but the impact on SATA drives is minimal because they are limited to QD32. Our new test suite will use up to 16 threads to issue IO.
Peak Random Read Performance
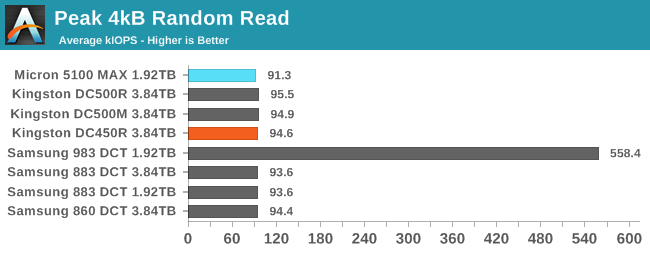
These SATA drives all have no trouble saturating the SATA link with 4kB random reads at high queue depths. The Micron 5100 MAX is technically the slowest of the bunch, but it's less than a 5% difference. That pales in comparison to the factor of 6 throughput improvement made possible by moving up to a NVMe drive. (Though to be fair, the NVMe drive peaks at a much higher queue depth of at least 80. At QD32, it's merely 3x faster than the SATA SSDs.)
 |
|||||||||
| Power Efficiency in kIOPS/W | Average Power in W | ||||||||
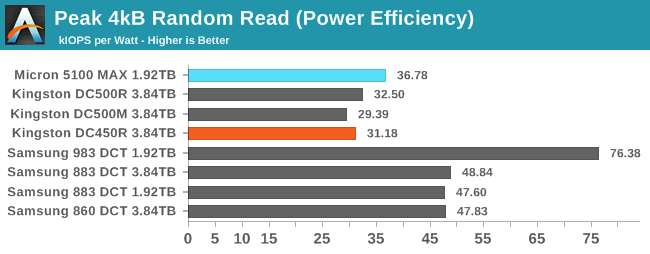
Peak random read performance may be very similar between these SATA drives, but there's still considerable variation in their power consumption and thus efficiency. The Samsung drives are the most efficient as usual, hovering just below 2W for this test compared to 2.5W for the Micron 5100 MAX and 3W for the Kingston drives.
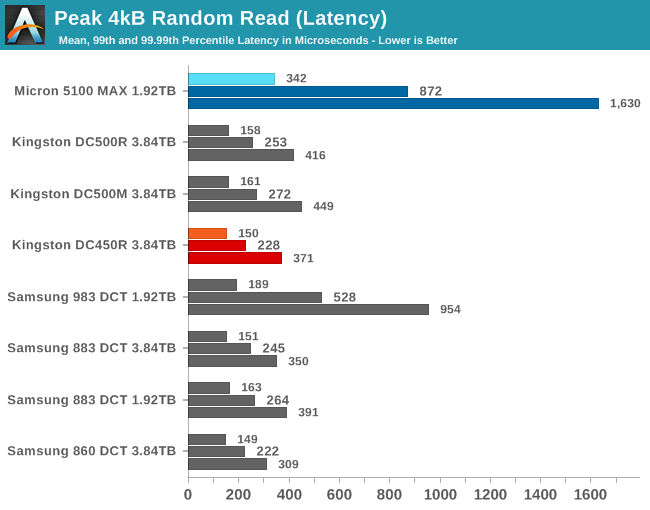
The Micron 5100 MAX has the worst latency scores of the bunch, the same outcome as for the QD1 random read test. Its tail latencies are much higher than any of the other SATA drives. The Samsung 983 DCT has the second-worst latency scores, but that's because it's operating at a much higher queue depth in order to hit 6x throughput. The Kingston DC450R actually manages slightly better latency scores than the other two Kingston drives, and that puts it on par with the Samsung SATA drives.
Peak Sequential Read Performance
Rather than simply increase the queue depth of a single benchmark thread, our sequential read and write tests first scale up the number of threads performing IO, up to 16 threads each working on different areas of the drive. This more accurately simulates serving up different files to multiple users, but it reduces the effectiveness of any prefetching the drive is doing.
 |
|||||||||
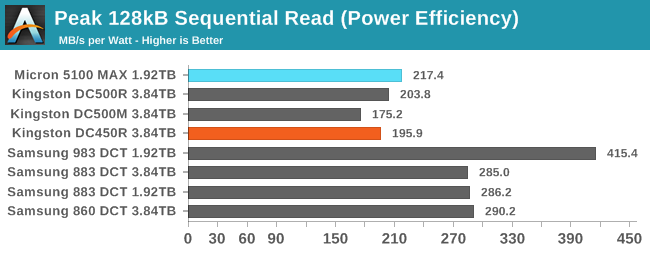
| Power Efficiency in MB/s/W | Average Power in W | ||||||||
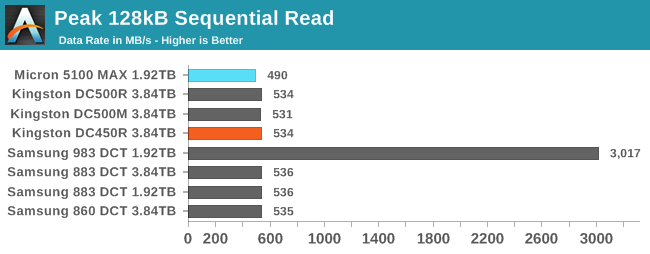
Moving up to higher queue depths doesn't really change the situation we saw with sequential reads at QD1. The SATA drives are all still performing about the same, with the Micron 5100 MAX a few percent slower than the more recent drives. That doesn't stop the 5100 MAX from being a bit more power efficient than the Kingston drives, but neither brand matches Samsung.
Steady-State Random Write Performance
Enterprise SSD write performance is conventionally reported as steady-state performance rather than peak performance. Sustained writing to a flash-based SSD usually causes performance to drop as the drive's spare area fills up and the SSD needs to spend some time on background work to clean up stale data and free up space for new writes. Conventional wisdom holds that writing several times the drive's capacity should be enough to get a drive to steady-state, because nobody actually ships SSDs with greater than 100% overprovisioning ratios. But in practice, things are a bit more complicated.
For starters, steady-state performance isn't necessarily worst-case performance. We've noticed several SSDs that show much worse random write performance if they were initially filled with sequential writes rather than random writes. Those drives actually speed up as they are preconditioned with random writes on their way to reaching steady state. Secondly, drives can be pretty good at recovering performance when they get any kind of respite from full-speed write pressure. So even though our enterprise test suite doesn't give SSDs any explicit idle time the way our consumer test suite does, running a read performance test or low-QD writes can give a drive the breathing room it needs to get caught up on garbage collection. We don't have the time to do several full drive writes for each queue depth tested (especially for slower SATA drives), so some of our write performance results end up surprisingly high compared to the drive's specifications. Real-world write performance depends not just on the current workload, but also on the recent history of how a drive has been used, and no single performance test can capture all the relevant effects.
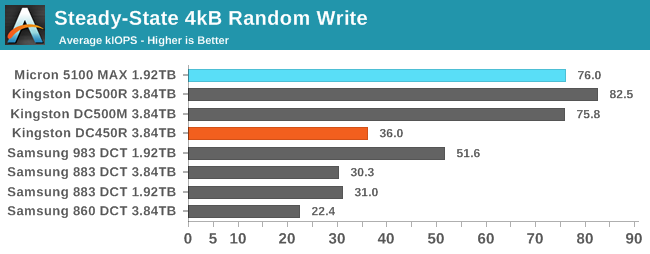
Thanks to its massive overprovisioning, it's no surprise to see the Micron 5100 MAX delivering great random write performance here, matching the Kingston DC500M. The Kingston DC500R performing even better is more of a surprise, and seems to be due more to the fact that our test procedure doesn't reliably keep it at steady-state; its random write performance under load definitely does drop down to the rated performance that is no better than the Samsung drives, but the structure of our automated tests didn't keep it at steady-state 100% of the time. Even the DC450R was caught only on the cusp of its steady-state, or else it would have scored only slightly better than the 860 DCT.
 |
|||||||||
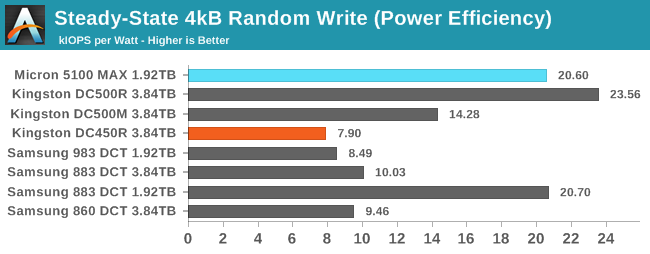
| Power Efficiency in kIOPS/W | Average Power in W | ||||||||
The drives with the highest random write performance also dominate the power efficiency chart for the most part. The Micron 5100 MAX scores very well here, as well it should. The Kingston DC500R's efficiency score is inflated by the fact that it hadn't fully reached steady-state; when it finally does, it and the DC450R end up drawing 5.5-6W and having half the performance per Watt of the next-worse drive in this batch. The 1.92 TB Samsung 883 DCT has surprisingly low power consumption here, indicating that it may have also not quite been in its lowest steady-state even though the performance was barely above its specifications.
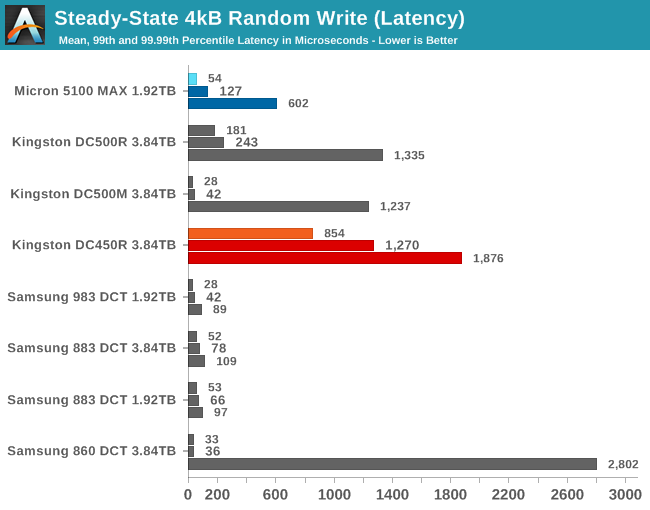
The Kingston SATA drives all have poor tail latency scores, and the DC450R's mean random write latency is pretty poor as well. It's possible these drives would show better QoS once they've fully reached steady state, but even if that's the case, it appears we've caught them in the midst of a rough transition toward steady-state. Despite being a very high-end drive for its time and being able to sustain excellent random write throughput, the Micron 5100 MAX also has poor QoS compared to the modern competition from Samsung.
Peak Sequential Write Performance
As with our sequential read test, we test sequential writes with multiple threads each performing sequential writes to different areas of the drive. This is more challenging for the drive to handle, but better represents server workloads with multiple active processes and users.
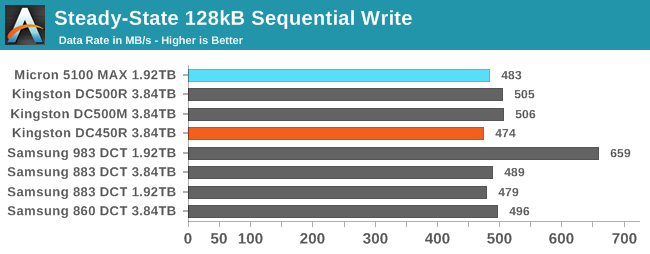
The bottleneck presented by the SATA bus is clearly preventing these drives from standing out in terms of sequential write performance. However, the 983 DCT shows that drives with 2-4TB of flash aren't necessarily that much faster once the SATA bottleneck is out of the way.
 |
|||||||||
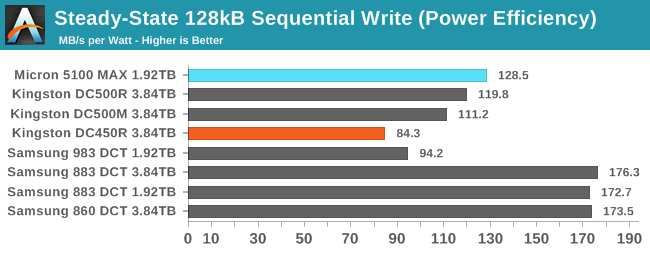
| Power Efficiency in MB/s/W | Average Power in W | ||||||||
As usual, the Samsung SATA drives turn in the best power efficiency scores. The Micron 5100 MAX has only three-fourths the performance per Watt, and the Kingston drives are worse that that. The DC450R is in last place for efficiency, since it draws twice as much power as a Samsung 883 DCT but is slightly slower.


20 Comments
View All Comments
FunBunny2 - Wednesday, February 5, 2020 - link
"So, even a "serious" database running on any reliable disk (ie: one not lying about flushes) will be 100% functional/safe; however, performance will tank."industrial strength RDBMS still offer (on *nix OSs, at least) raw devices, which means the database engine does all the I/O, and always (IIRC) runs with more integrity guarantees and efficiency. it's just that *nix OSs have gotten sufficiently better at both over the last couple of decades that most RDMBS app developers discourage their clients from configuring that way.
FunBunny2 - Wednesday, February 5, 2020 - link
"There is a difference between data integrity and persistency, but power-loss protection is needed for either."depends on what the definition of 'it' is. way back in the late 80s and early 90s, SQL databases ran on machines without UPS or other forms power persistence. what industrial strength RDBMS did guarantee is that a use session would lose only its last in-memory transaction. app developers took this into account when designing transactions. they still have to, since any number of failure modes exist beyond just pulling the plug. RDBMS did, and still do, only guarantee integrity of data written to the write-ahead-log, which is where in-memory data is flushed on transaction completion. widespread use of storage class memory, and OS support for same beyond simulating a filesystems (gad!), will change this protocol. won't be next week.
Siddhartha - Wednesday, February 5, 2020 - link
Is there something I can do to stop your endless loop video popups? I understand you earn your living with advertising but the popups actually block your content. I usually spend a couple minutes on website and go somewhere because of the popups.RealBeast - Wednesday, February 5, 2020 - link
What video popups? cough, MVPS host file blocking, coughleexgx - Wednesday, February 5, 2020 - link
I exclusively use edge mobile browser on this website (the forums are even worse a floating video that follows you when you move up and down blocking over 70% of the page) 3 other sites that I use it on as well as they launch full screen ad when you click on a link for the first time or i page ads are floating with the page or randomly opening other pages when you try to swipe down (it thinks your tapping the add when your trying to pull down)Supercell99 - Wednesday, February 5, 2020 - link
Nothing about the Kingston drives are "Enterprise" . The DWPD are nothing special. The lack of power loss protection capacitors is a deal breaker. I don't care if it is read heavy. Enterprise means, critical data and business use with $$$$ at stake. Loss of data and downtime is very expense. No power caps and <1 DWPD makes this just another SATA SSD, "Enterprise" is some label they threw on to make some extra cash from suckers.Foeketijn - Saturday, February 8, 2020 - link
I bought a samsung 983 for 200 something euro's.Nice to install Windows server in about 2 minutes (and then need about 10 to go thought the bloatware options).
dromoxen - Wednesday, February 12, 2020 - link
Its a shame they couldnt do a quick re-write of the firmware , nobody? needs 42% over provisioning. Maybe take it down to 5,10.. that can be changed on installation. Voila , a shedload of extra capacity, which I would presume is the second selling point , after simply being a SATA ssd.