Transcend SSD370 (128GB, 256GB & 512GB) Review
by Kristian Vättö on January 27, 2015 8:00 AM EST- Posted in
- Storage
- SSDs
- Transcend
- Silicon Motion
- SM2246EN
AnandTech Storage Bench 2013
Our Storage Bench 2013 focuses on worst-case multitasking and IO consistency. Similar to our earlier Storage Benches, the test is still application trace based – we record all IO requests made to a test system and play them back on the drive we are testing and run statistical analysis on the drive's responses. There are 49.8 million IO operations in total with 1583.0GB of reads and 875.6GB of writes. I'm not including the full description of the test for better readability, so make sure to read our Storage Bench 2013 introduction for the full details.
| AnandTech Storage Bench 2013 - The Destroyer | ||
| Workload | Description | Applications Used |
| Photo Sync/Editing | Import images, edit, export | Adobe Photoshop CS6, Adobe Lightroom 4, Dropbox |
| Gaming | Download/install games, play games | Steam, Deus Ex, Skyrim, Starcraft 2, BioShock Infinite |
| Virtualization | Run/manage VM, use general apps inside VM | VirtualBox |
| General Productivity | Browse the web, manage local email, copy files, encrypt/decrypt files, backup system, download content, virus/malware scan | Chrome, IE10, Outlook, Windows 8, AxCrypt, uTorrent, AdAware |
| Video Playback | Copy and watch movies | Windows 8 |
| Application Development | Compile projects, check out code, download code samples | Visual Studio 2012 |
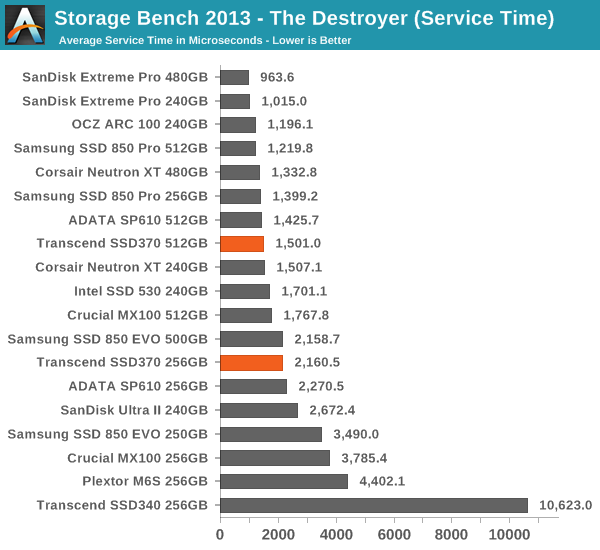
We are reporting two primary metrics with the Destroyer: average data rate in MB/s and average service time in microseconds. The former gives you an idea of the throughput of the drive during the time that it was running the test workload. This can be a very good indication of overall performance. What average data rate doesn't do a good job of is taking into account response time of very bursty (read: high queue depth) IO. By reporting average service time we heavily weigh latency for queued IOs. You'll note that this is a metric we have been reporting in our enterprise benchmarks for a while now. With the client tests maturing, the time was right for a little convergence.
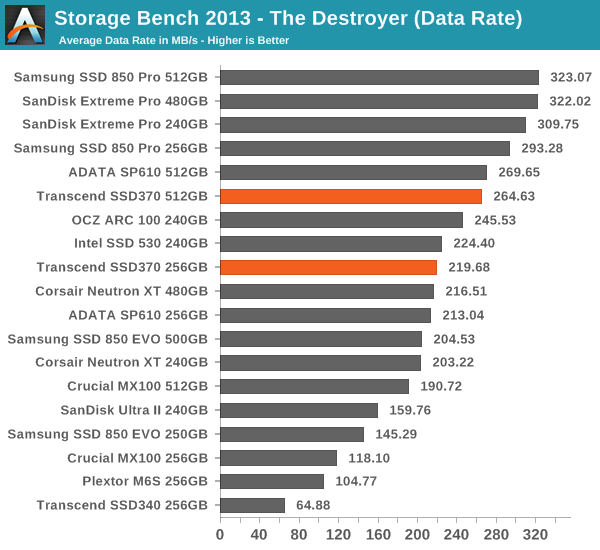
What surprises me is that the SSD370 does so well in the 2013 Storage Bench even though its IO consistency is leaves a lot to be desired. Again the performance is a very close match with the SP610 and overall the SSD370 is a fairly capable middle-class performer.


44 Comments
View All Comments
Hulk - Tuesday, January 27, 2015 - link
Perhaps I missed it but no mention/testing of endurance? All I see are manufacturer quoted numbers in the table.DanNeely - Tuesday, January 27, 2015 - link
Barring catastrophic failures, endurance testing a drive to destruction takes many months. Tech Report started torturing a set of 256GB drives in late 2013; as of last month 2 of the 6 drives were still running.http://techreport.com/review/27436/the-ssd-enduran...
Hulk - Tuesday, January 27, 2015 - link
I guess you don't read Anandtech much. Generally they run down the drive enough to move the counter down a few percent, then make a good estimate of endurance based on those numbers. I think it's very interesting and pretty much only Anandtech does it. Or used to do it.extide - Tuesday, January 27, 2015 - link
Maybe it's you that doesn't read AT that much ;) (Haha, I had to)They typically will only do that when they are testing drives with a new type of NAND that we haven't seen yet before, or testing some weird scenario, or something like that. Micron 20nm NAND is a well known entity at this point, and even though they are using custom firmware on this controller, it's performance and behavior seems very similar to the stock SMI firmware -- so basically there is nothing remarkable here. I am sure the endurance will be similar to most other drives with this type of NAND.
Kristian Vättö - Tuesday, January 27, 2015 - link
Right on the spot. I only do endurance testing with new NAND generations that we haven't seen before to figure out the P/E cycle rating. It takes days, possibly weeks, so there is no point in testing that with every drive. After all, the manufacturers' ratings still matter because once those are reached the warranty will be voided anyway, so my endurance tests aim to tell more about the NAND than the drive itself.Hulk - Tuesday, January 27, 2015 - link
Okay makes sense.I can admit when I'm wrong.
Hulk - Tuesday, January 27, 2015 - link
But wait. Does it take days or weeks to run down the counter 1 or 2 percent? That's all you need to get an estimate on actual endurance right?And isn't there variation in the NAND that each manufacturer buys for each line of drives? I'm talking about the binning and how endurance can vary for the same process.
Kristian Vättö - Tuesday, January 27, 2015 - link
The problem is finding the exact spot where the counter changes by 1 percent, so it usually takes at least a few percent worth of cycling to find that. Generally it takes a couple of days for client drives, but even then that time is away from testing other drives.You are correct that not every die is equal, but the P/E cycle rating is usually conservative to guarantee that all SSD-grade dies comply that spec. With binning and parameter trimming it's possible to get much more out of the dies though.
Hulk - Tuesday, January 27, 2015 - link
Wow. Thanks for the specific reply.Souka - Wednesday, January 28, 2015 - link
Just thought to share:I've fried 3 brand new SSDs in my torrent box over the past year. Granted two were 64GB, one 120GB, and they were pretty meh to begin with performance wise.
I knew the SSD wouldn't last, but didn't expect it to fail that quickly. Currently have an OLD 64GB Intel SLC (X25 I think) in for past few months...no issue yet.