Preparing For Future Software: AMD's Lightweight Profiling Proposal
by Ryan Smith on August 16, 2007 12:00 AM EST- Posted in
- CPUs
The Importance of Profiling
To understand what exactly AMD is attempting to accomplish, we first need to backtrack somewhat and talk about performance analysis, the task AMD is intending to improve with the LWP. Because of the sheer complexity of modern high-performance processors and high-performance applications, searching for performance bottlenecks solely through an understanding of code is virtually impossible. Due to this limitation, developers have over the years written toolsets that attempt to straddle the hardware/software boundary by recording and interpret the actions of the hardware, to identify what code is being run and what the hardware is doing that is greatly impacting the performance of an application. This is performance analysis, and the tools used to do this task are called profilers.
Traditional profilers attempt to measure performance via timing, hardware interrupts, and other low-level tricks to coerce the hardware in to giving additional information on its state and current instructions being run. This kind of performance analysis can be extremely effective, but it also has an inherent downside: these profilers slow down the system and interrupt the program being profiled. The hardware may be acting differently because of the profiler, conflicting with the intended goal.
Unfortunately for this problem, profiling is increasingly necessary as developers continue to move to higher-level languages and parallel processing technologies. C and C++, the traditional high-level languages for high-performance applications are being usurped by managed environments such as Java and the Microsoft .Net framework. Managed code can offer better security, improved threading, and write-once run-anywhere functionality through virtual machines which in turn avoids many issues with porting a program to other platforms.
Meanwhile the entire imperative programming model that is behind the design of C, Java, Visual Basic, C#, and the other major programming languages is poor suited for multithreading. Some of the most pessimistic predictions for game development for example put the development time of a multithreaded engine at three times that of a single threaded engine. Profilers help in this regard by helping developers catch stalls and other problems that result from managing multiple threads.
It's all of these problems that AMD wants to resolve with their Lightweight Profiling Proposal. What AMD proposes is a section of silicon on a CPU dedicated to assisting with profiling, and a new set of instructions to work with the hardware. The profiling hardware would be able to properly monitor the rest of the CPU, as opposed to the guessing done by software profilers, and return this more precise information to the developer.
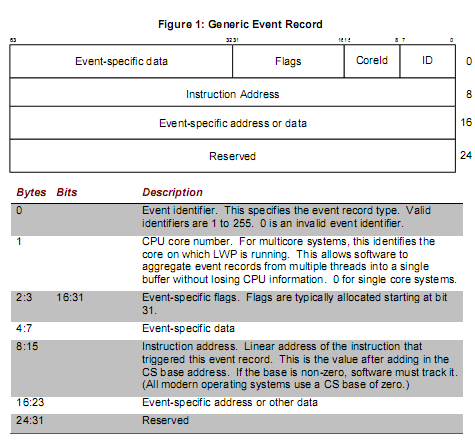
It's a fundamentally simple concept, the proposal calls for all of this being done with only two instructions: LLWPCB and SLWPCB to enable/disable profiling and retrieve the data respectively. Yet the potential results could be extremely useful, allowing developers to identify the precise latency of certain operations, count cache hits, or retrieve the exact instruction being processed. Furthermore all of this occurs while triggering a fraction of the interrupts (the reasoning behind the "lightweight" name) and without causing the processor to act different as software profiling tools can cause, all of this leading to better profiling that should translated in to more finely optimized applications.
Even wilder ideas for using these instructions exist in the realm of managed code. Because LWP is lightweight and real time, the possibility is left open that Just-In-Time(JIT) compilers used by managed environments could use the profilers on themselves and change how they're compiling code and handing data to improve performance on the fly. As we'll see there are some outstanding issues with AMD's proposal that would specifically affect this use, but the potential is there.


11 Comments
View All Comments
MadBoris - Thursday, August 16, 2007 - link
I can't help but wonder what advantages this would have over Intel's existing open source TBB. Threading Building Blocks 2.0 seems to be a pretty robust runtime library to be able to do the hard work covering some of the most difficult things to manage currently...Efficient parallelism.
Automatic load balancing.
Easier thread management.
Help with concurrency issues.
Plus Intels companion tools are awesome. Expensive but pretty nice.
TBB is also open source and multiplatform friendly.
I'm also curious to learn more about real world TBB experiences.
Anyway, it's good to hear more work is being done on this stuff and different approaches will always help.
We have a long way to go because as it is Quad cores and above will not really be leveraged like everyone assumes they will be. It will take more than market saturation of multicores for them to be used efficiently. Unless an application is manipulating data streams, which has an easily splittable workload, like encoding, rendering, compression, etc. then you really won't see the type of workload granularity from other types of applications in truly leveraging multicores. Core's beyond 2 will offer ever decreasing negligible results for quite a while in mainstream applications without some advances.
I hope to hear more about advances on this in future articles because as it is, it seems quad will be somewhat of a wall for us of any real beneficial performance, anything above that will really just serve as a good heater unless it's for a very specific application.
Ryan Smith - Thursday, August 16, 2007 - link
LWP isn't intended to be competition for TBB, rather it augments it (at least as much as TBB is beneficial on an AMD chip). TBB is compiler and library help, an essential part of extracting maximum performance, but it doesn't include anything as far as application profiling goes. LWP is the final link as far as that goes, once TBB has taken you as far as it can, you break out profilers and start looking at what your code is doing that could be causing any more performance bottlenecks.JumpingJack - Sunday, August 19, 2007 - link
I think one of the points he is making is that this is really not a methodology or instruction set change that is used for multithreading, rather a HW based profiler which is only useful during product development.Profiling is not new, so while AMD is proposing some unique intructions to get a realtime peak of the architectural state (profiling), it does not directly speed up multithreading by some new or novel algorithm. Basically, what AMD is proposing is pretty much already used at a software level to an extent.
MadBoris - Sunday, August 19, 2007 - link
Yeah, while profiling is necessary especially for multithreaded apps for optimizing and finding overhead, stalls, IPC issues, synchronized contention, etc., I'm far more interested in the core issues of leveraging cores for better parallel execution. Rather than a better topical ointment we need to address the core cause. Initially I had thought AMD was doing more than just profiling with the extra architecture, but that was due to my silly skimming.I also mentioned TBB because I think it also may be worthy of an article someday, it is an intriguing route to the core problems developers are facing in multithreading in the future. I'm curious how well it works, from engineers feedback, something Anandtech would have access to. Making a thread and throwing it to another core today is all well and good in removing thread contention for primary threads and giving other threads more CPU budget, but lower level multithreading and parallel advantages are currently limited for most types of apps due to inherent limitations. That's the real core issue in multithreading, improving scaling and fully leveraging several cores.
I'm interested to see what AMD's methods may bring in improved performance and maybe ways to gather a few more tidbits of data, much still depends on the software element and how it will present the data and how robust it will be during development time. Who knows, maybe they are putting the horse out first then bringing in the cart next, it would be the right order of things. Having a HW profiler in place first would make it easier to produce and test, a HW based multithreading optimizing approach, which would be stellar someday down the road.
MadBoris - Thursday, August 16, 2007 - link
Maybe LWP can lessen overhead w/ HW and even be more precise, as you say. Although their is a good bit you can retrieve in software, so it will be interesting to see what it is I am missing, maybe some deeper level CPU cache usage metrics maybe beneficial. Time will tell.yyrkoon - Friday, August 17, 2007 - link
Dude, do you even know what software profiling *is* ? I have no idea what TBB *is*, but I can tell you with 99.9% certainty is is not even remotely related(except perhaps that it is a set of instructions).Direct quote from wikipedia:
http://en.wikipedia.org/wiki/Performance_analysis">http://en.wikipedia.org/wiki/Performance_analysis
MadBoris - Friday, August 17, 2007 - link
Thank you for the definition. I just finished saying I have used Intels profilers in profiling applications, so I may know.As to TBB, it's a runtime tool for making threaded applications more efficient and easier to produce, not a profiler. I initially thought AMD's approach was going to be more than just profiling, but that's what I get for skimming articles.
MadBoris - Thursday, August 16, 2007 - link
And of course the Intel Threading tools which work in cooperation with TBB are very robust as well, which have been around for a while. I've used the Thread Checker and Threading Profiler and I like them pretty well, pretty impressive actually, although you can incur some serious overhead with the profilers if your not careful.http://www.intel.com/cd/software/products/asmo-na/...">http://www.intel.com/cd/software/products/asmo-na/...
The more the merrier, just was wondering what LWP was adding beyond what I was already familiar with on the Intel side.
DigitalFreak - Thursday, August 16, 2007 - link
Unless Microsoft puts the boot to Intel again, I doubt Intel will jump on board. They have too much of a "nowhere but here" mentality.DeepThought86 - Thursday, August 16, 2007 - link
I think this article could have been written with 30% less words