Kingston DataTraveler Max UFD Series Review: New Type-A Thumb Drive Retains NVMe Performance
by Ganesh T S on July 11, 2022 9:08 AM EST- Posted in
- Storage
- SSDs
- Kingston
- flash
- DAS
- Silicon Motion
- USB 3.2 Gen 2
- Portable SSDs
Performance Benchmarks
Benchmarks such as ATTO and CrystalDiskMark provide a quick look at the performance of the direct-attached storage device. The results translate to the instantaneous performance numbers that consumers can expect for specific workloads, but do not account for changes in behavior when the unit is subject to long-term conditioning and/or thermal throttling. Yet another use of these synthetic benchmarks is the ability to gather information regarding support for specific storage device features that affect performance.
Synthetic Benchmarks - ATTO and CrystalDiskMark
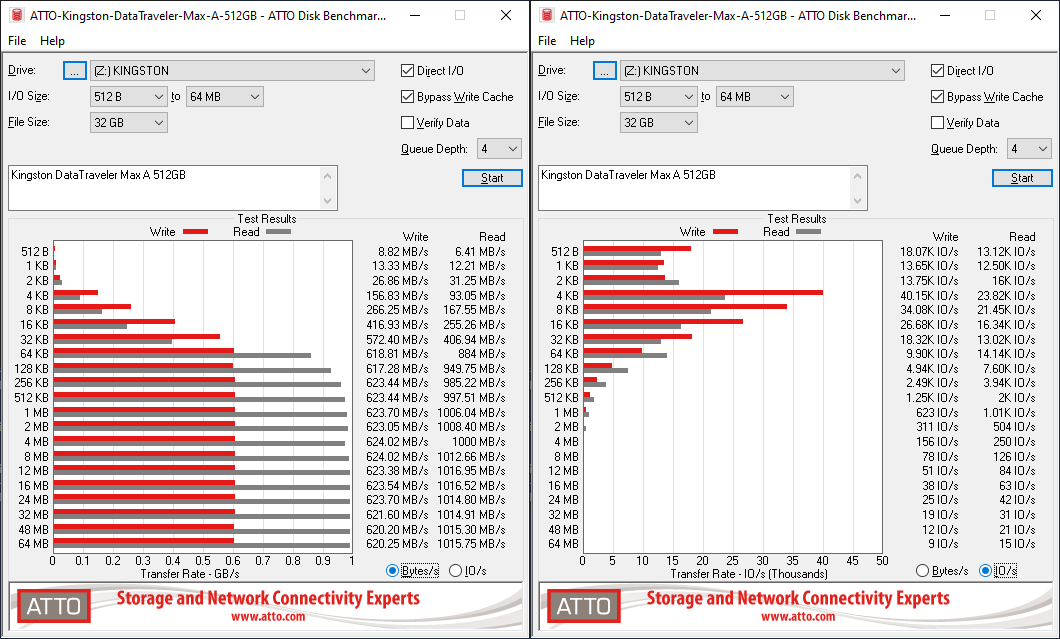
Kingston claims read and write speeds of 1000 MBps and 900 MBps respectively for the DTMAX series. While the 1TB DTMax Type-C managed to hit that in the ATTO benchmarks, our chosen workloads don't see the DTMAXA SKUs hitting it - not even in the 1TB version. Writes top out around 650 MBps, while the reads do go close to 1000 MBps. ATTO benchmarking is restricted to a single configuration in terms of queue depth, and is only representative of a small sub-set of real-world workloads. It does allow the visualization of change in transfer rates as the I/O size changes. Even though screenshots are not shown here, setting the ATTO benchmark's queue depth to 8 (instead of the 4 we usually use) allows the numbers in the graph to go beyond even Kingston's advertised claims. That said, it is evident that the DT Max Type-C 1TB we evaluated last year is not exactly the same performance-wise as the new DTMAXA/1TB.
| ATTO Benchmarks | |
| TOP: | BOTTOM: |
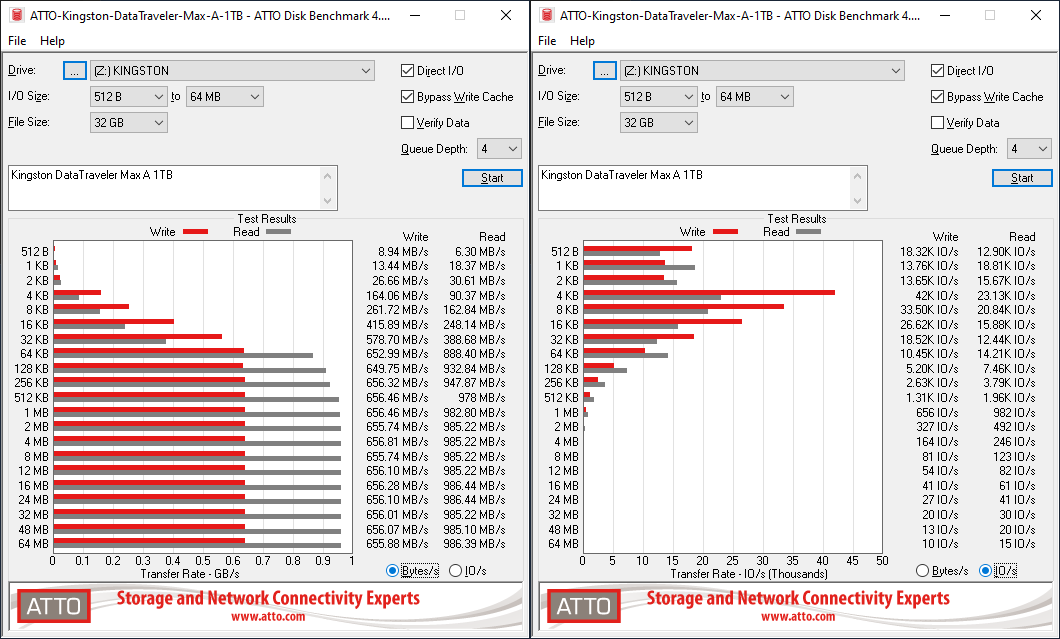 |
|
 |
|
CrystalDiskMark. for example, uses four different access traces for reads and writes over a configurable region size. Two of the traces are sequential accesses, while two are 4K random accesses. Internally, CrystalDiskMark uses the Microsoft DiskSpd storage testing tool. The 'Seq128K Q32T1' sequential traces use 128K block size with a queue depth of 32 from a single thread, while the '4K Q32T16' one does random 4K accesses with the same queue configuration, but from multiple threads. The 'Seq1M' traces use a 1MiB block size. The plain 'Rnd4K' one uses only a single queue and single thread . Comparing the '4K Q32T16' and '4K Q1T1' numbers can quickly tell us whether the storage device supports NCQ (native command queuing) / UASP (USB-attached SCSI protocol). If the numbers for the two access traces are in the same ballpark, NCQ / UASP is not supported. This assumes that the host port / drivers on the PC support UASP.
| CrystalDiskMark Benchmarks | |
| TOP: | BOTTOM: |
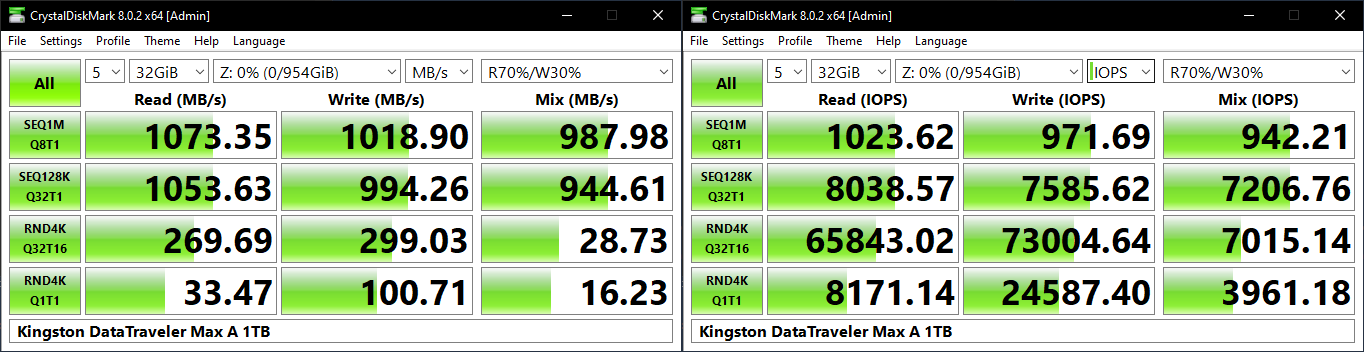 |
|
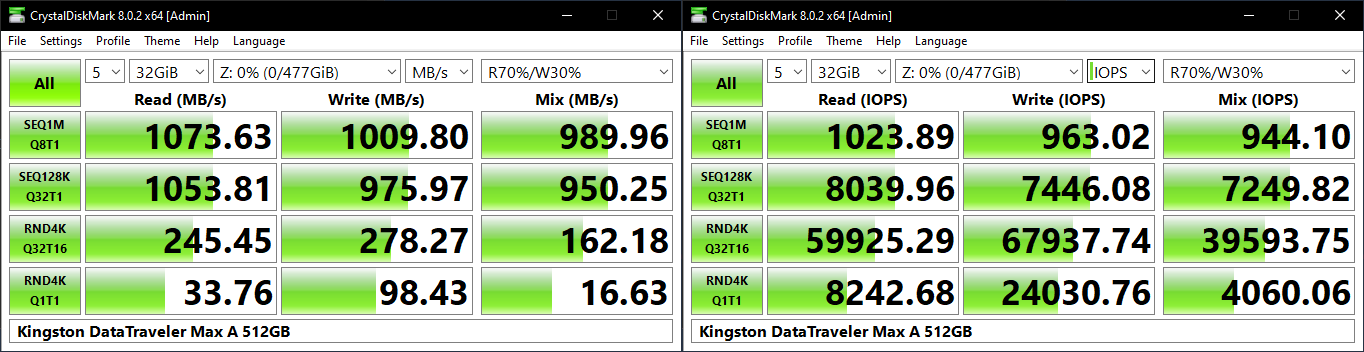 |
|
The numbers here match Kingston's advertised claims - the DT Max Type-C and Type-A 1TB UFDs behave pretty much the same. The 512GB and 1TB SKUs exceed the advertised numbers. However, the 256GB version suffers on the write side, hitting a peak slightly south of 800 MBps. For the same access trace, the 512GB and 1TB SKUs reach almost 1 GBps. This is likely due to the non-availability of enough flash packages to access parallely in the 256GB SKU.
AnandTech DAS Suite - Benchmarking for Performance Consistency
Our testing methodology for storage bridges / direct-attached storage units takes into consideration the usual use-case for such devices. The most common usage scenario is transfer of large amounts of photos and videos to and from the unit. Other usage scenarios include the use of the unit as a download or install location for games and importing files directly from it into a multimedia editing program such as Adobe Photoshop. Some users may even opt to boot an OS off an external storage device.
The AnandTech DAS Suite tackles the first use-case. The evaluation involves processing five different workloads:
- AV: Multimedia content with audio and video files totalling 24.03 GB over 1263 files in 109 sub-folders
- Home: Photos and document files totalling 18.86 GB over 7627 files in 382 sub-folders
- BR: Blu-ray folder structure totalling 23.09 GB over 111 files in 10 sub-folders
- ISOs: OS installation files (ISOs) totalling 28.61 GB over 4 files in one folder
- Disk-to-Disk: Addition of 223.32 GB spread over 171 files in 29 sub-folders to the above four workloads (total of 317.91 GB over 9176 files in 535 sub-folders). This workload is applicable only to drives of capacity more than 512GB)
Except for the 'Disk-to-Disk' workload, each data set is first placed in a 29GB RAM drive, and a robocopy command is issue to transfer it to the external storage unit (formatted in exFAT for flash-based units, and NTFS for HDD-based units).
robocopy /NP /MIR /NFL /J /NDL /MT:32 $SRC_PATH $DEST_PATH
Upon completion of the transfer (write test), the contents from the unit are read back into the RAM drive (read test) after a 10 second idling interval. This process is repeated three times for each workload. Read and write speeds, as well as the time taken to complete each pass are recorded. Whenever possible, the temperature of the external storage device is recorded during the idling intervals. Bandwidth for each data set is computed as the average of all three passes.
The 'Disk-to-Disk' workload involves a similar process, but with one iteration only. The data is copied to the external unit from the CPU-attached NVMe drive, and then copied back to the internal drive. It does include more amount of continuous data transfer in a single direction, as data that doesn't fit in the RAM drive is also part of the workload set.
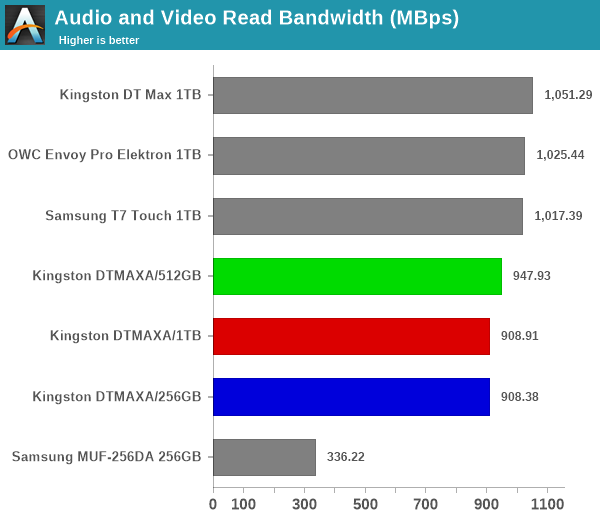
The read workloads see all the DTMAXA drives performing quite well and being very close to the leader of the pack. On the write side, the 256GB SKU fares quite badly, as the SLC cache exhaustion coupled with insufficient time for folding makes it fare worse than even the Samsung MUF-256DA Type-C thumb drive. The 512GB and 1TB SKUs perform quite well, with the queue depth issue seen in the ATTO workload not making that much of a dent for real-world performance.
-Power users may want to dig deeper to understand the limits of each device. To address this concern, we also instrumented our evaluation scheme for determining performance consistency.
Performance Consistency
Aspects influencing the performance consistency include SLC caching and thermal throttling / firmware caps on access rates to avoid overheating. This is important for power users, as the last thing that they want to see when copying over 100s of GB of data is the transfer rate going down to USB 2.0 speeds.
In addition to tracking the instantaneous read and write speeds of the DAS when processing the AnandTech DAS Suite, the temperature of the drive was also recorded. In earlier reviews, we used to track the temperature all through. However, we have observed that SMART read-outs for the temperature in NVMe SSDs using USB 3.2 Gen 2 bridge chips end up negatively affecting the actual transfer rates. To avoid this problem, we have restricted ourselves to recording the temperature only during the idling intervals. The graphs below present the recorded data.
| AnandTech DAS Suite - Performance Consistency | |
| TOP: | BOTTOM: |
 |
|
 |
|
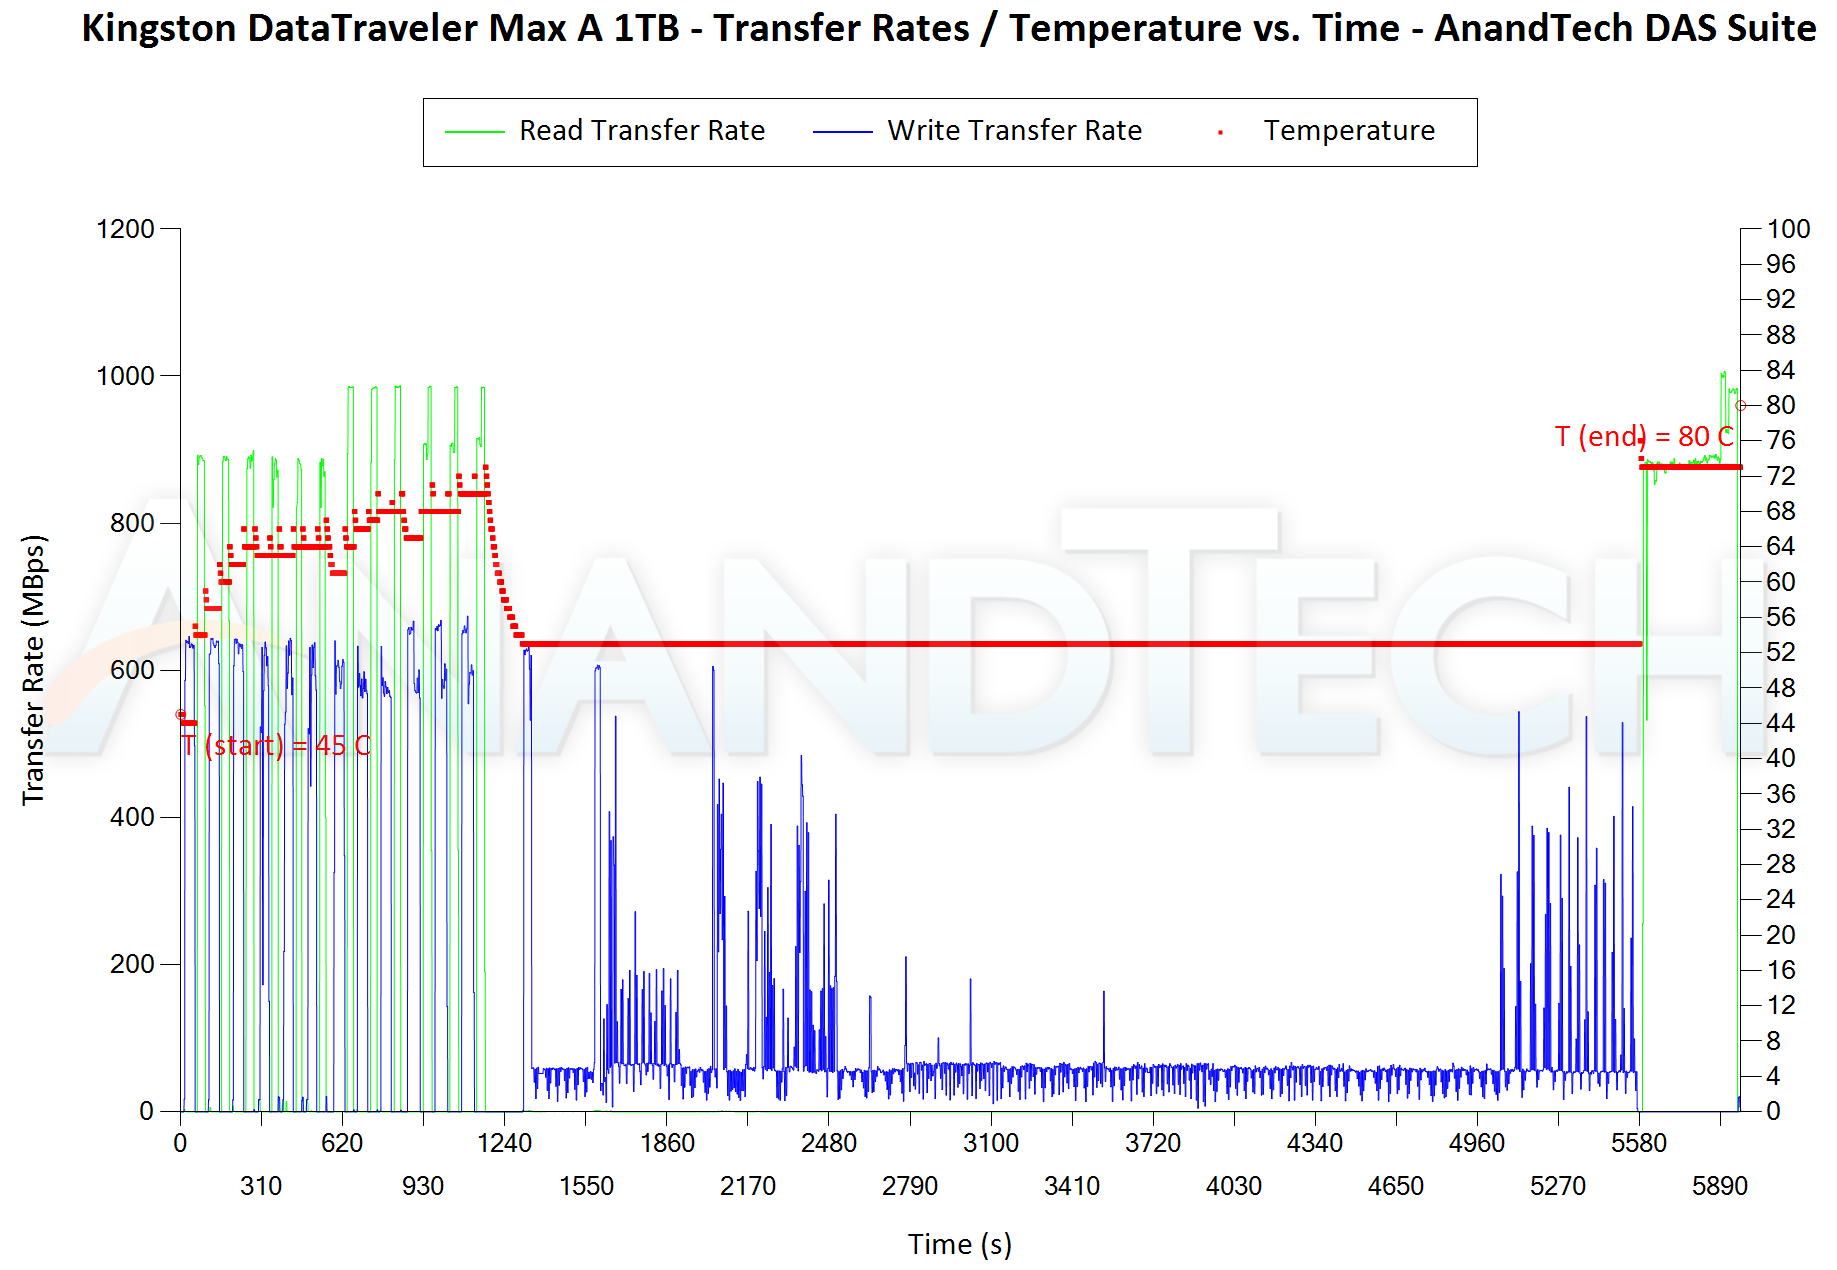
The first three sets of writes and reads correspond to the AV suite. A small gap (for the transfer of the video suite from the internal SSD to the RAM drive) is followed by three sets for the Home suite. Another small RAM-drive transfer gap is followed by three sets for the Blu-ray folder. This is followed up with the large-sized ISO files set. Finally, we have the single disk-to-disk transfer set.
The key comparison here is between the DT Max A 1TB and the DT Max 1TB. Due to the queue depth issue, default write performance for the DT Max A starts off slightly north of 600 MBps, while the Type-C version starts off above 900 MBps. This negatively impacts the Type-C version towards the end - after the temperature hits 90C+, the read speeds drop down to the 550 MBps range. On the other hand, the new Type-A 1TB SKU manages to retain the high read performance all through - the temperature at the end was 80C (and the last read set started at 74C). Thus, the comparatively slow writes help in the thermal performance for the new drives.
PCMark 10 Storage Bench - Real-World Access Traces
There are a number of storage benchmarks that can subject a device to artificial access traces by varying the mix of reads and writes, the access block sizes, and the queue depth / number of outstanding data requests. We saw results from two popular ones - ATTO, and CrystalDiskMark - in a previous section. More serious benchmarks, however, actually replicate access traces from real-world workloads to determine the suitability of a particular device for a particular workload. Real-world access traces may be used for simulating the behavior of computing activities that are limited by storage performance. Examples include booting an operating system or loading a particular game from the disk.
PCMark 10's storage bench (introduced in v2.1.2153) includes four storage benchmarks that use relevant real-world traces from popular applications and common tasks to fully test the performance of the latest modern drives:
- The Full System Drive Benchmark uses a wide-ranging set of real-world traces from popular applications and common tasks to fully test the performance of the fastest modern drives. It involves a total of 204 GB of write traffic.
- The Quick System Drive Benchmark is a shorter test with a smaller set of less demanding real-world traces. It subjects the device to 23 GB of writes.
- The Data Drive Benchmark is designed to test drives that are used for storing files rather than applications. These typically include NAS drives, USB sticks, memory cards, and other external storage devices. The device is subjected to 15 GB of writes.
- The Drive Performance Consistency Test is a long-running and extremely demanding test with a heavy, continuous load for expert users. In-depth reporting shows how the performance of the drive varies under different conditions. This writes more than 23 TB of data to the drive.
Despite the data drive benchmark appearing most suitable for testing direct-attached storage, we opt to run the full system drive benchmark as part of our evaluation flow. Many of us use portable flash drives as boot drives and storage for Steam games. These types of use-cases are addressed only in the full system drive benchmark.
The Full System Drive Benchmark comprises of 23 different traces. For the purpose of presenting results, we classify them under five different categories:
- Boot: Replay of storage access trace recorded while booting Windows 10
- Creative: Replay of storage access traces recorded during the start up and usage of Adobe applications such as Acrobat, After Effects, Illustrator, Premiere Pro, Lightroom, and Photoshop.
- Office: Replay of storage access traces recorded during the usage of Microsoft Office applications such as Excel and Powerpoint.
- Gaming: Replay of storage access traces recorded during the start up of games such as Battlefield V, Call of Duty Black Ops 4, and Overwatch.
- File Transfers: Replay of storage access traces (Write-Only, Read-Write, and Read-Only) recorded during the transfer of data such as ISOs and photographs.
PCMark 10 also generates an overall score, bandwidth, and average latency number for quick comparison of different drives. The sub-sections in the rest of the page reference the access traces specified in the PCMark 10 Technical Guide.
Booting Windows 10
The read-write bandwidth recorded for each drive in the boo access trace is presented below.
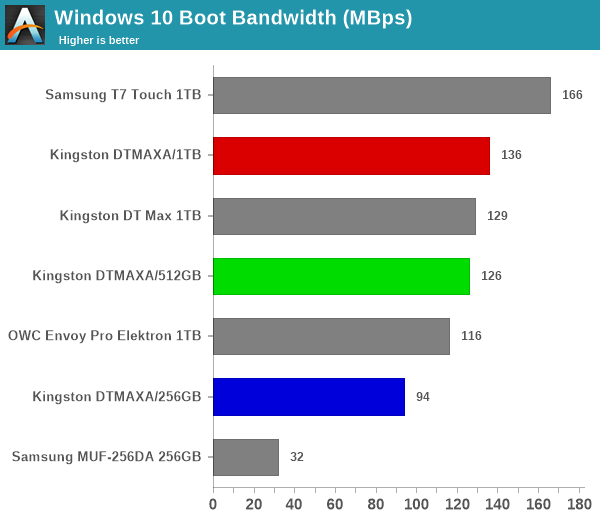
Being read-intensive, all three DTMAXA drives do well in the OS booting access trace.
Creative Workloads
The read-write bandwidth recorded for each drive in the sacr, saft, sill, spre, slig, sps, aft, exc, ill, ind, psh, and psl access traces are presented below.
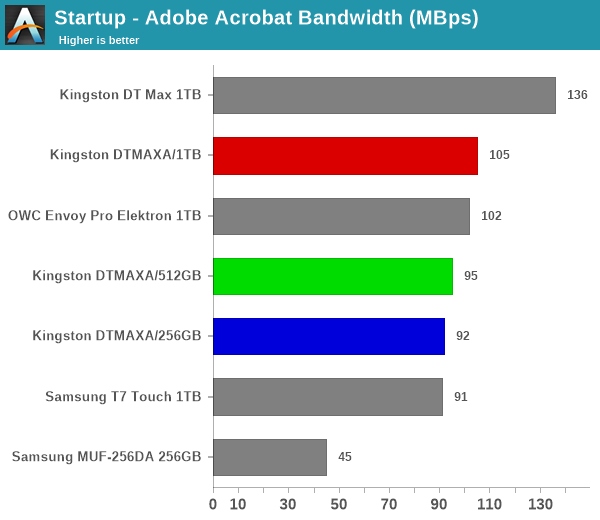
The DTMAXA drives perform reasonably well, making an appearance in the middle of the pack and without any suspiciously small scores. The DT Max Type-C and Type-A drives perform similarly, with the Type-C version enjoying a slight edge all through.
Office Workloads
The read-write bandwidth recorded for each drive in the exc and pow access traces are presented below.
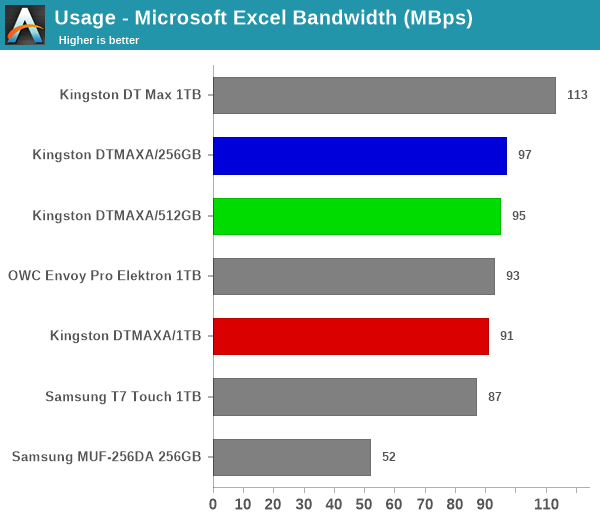
The DTMAXA series performs quite well given the use of a native UFD controller. However, the Type-C drive's firmware / flash combination gives it the edge in office workloads.
Gaming Workloads
The read-write bandwidth recorded for each drive in the bf, cod, and ow access traces are presented below.
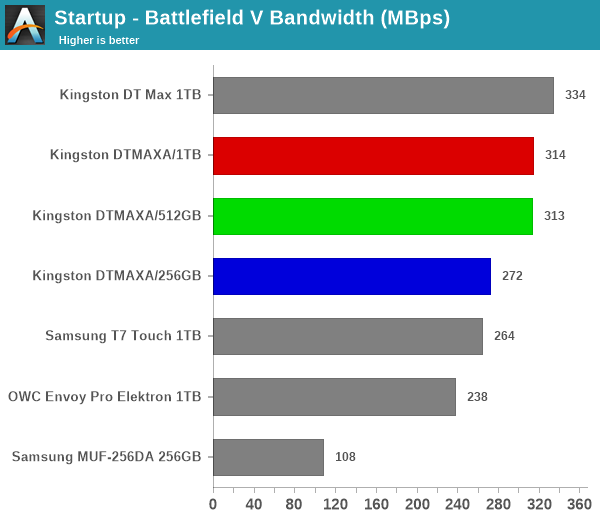
The read-intensive nature of gaming workloads are more in tune with the DT Max use-cases. Even though the DTMAXA SKUs appear in the top half, it is the Type-C UFD that enjoys a clear lead.
Files Transfer Workloads
The read-write bandwidth recorded for each drive in the cp1, cp2, cp3, cps1, cps2, and cps3 access traces are presented below.
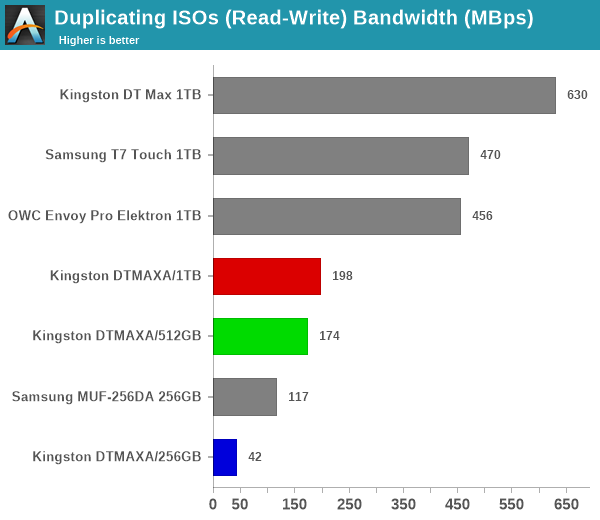
A combination of thermal throttling and SLC cache run-out throttling yields the above results for various SSDs. The trend is overall the same - the Type-C version outperforms the Type-A version. Read-centric workloads are welcome across the board by the DTMAXA series. On the write front, bridge-based SSDs as well as the Type-C DT Max 1TB enjoy a commanding lead.
Overall Scores
PCMark 10 reports an overall score based on the observed bandwidth and access times for the full workload set. The score, bandwidth, and average access latency for each of the drives are presented below.
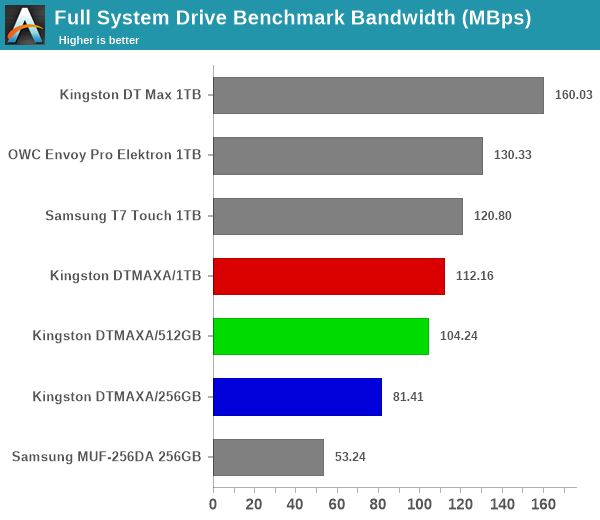
As expected, the DTMAXA series lands in the middle of the pack, with the 1TB outperforming the 512GB, and that in turn outperforms the 256GB SKU. The Type-C UFD emerges as the leader despite the presence of a couple of bridge-based SSD solutions in the mix. The new Type-A version is behind those, though


17 Comments
View All Comments
LonnieG - Monday, July 11, 2022 - link
In all the power consumption charts, I request give you provide a total energy consumed for the duration of the test (assuming it is the same time interval), not just the instantaneous consumption vs time. Peak power is good to figure out the power supply requirements - but we should be more concerned with the total energy consumed. Obviously, this is not very important for a thumb drive, but for the more power hungry components it may be a large contributor to the total cost of ownership.DanNeely - Monday, July 11, 2022 - link
Even if it drew 5W at all time and was plugged in 24/7 the yearly energy cost would only be in the $5-15 range (10-30 cents/kwh). In more realistic scenarios the dollar cost is going to be much lower. Where the absolute amount of power consumed might matter is scenarios where it's plugged into a phone or other device with a relatively small battery instead of wall power.YaBaBom - Friday, July 15, 2022 - link
A 5W constant draw could cut the battery life on many laptops by 20-50%--I'd say that's very significant, though unlikely (the pictured case couldn't dissipate 5W). Still, knowing the watts/hour consumed by this device would be a useful metric.DanNeely - Monday, July 11, 2022 - link
Could you review the SanDisk 256GB Ultra Dual Drive, or another model with dual USB A and C ports on it? If/when I buy a new flash drive, I'd like a model that will work both with my older PCs and newer laptops/mobile devices without needing dongles.Silver5urfer - Monday, July 11, 2022 - link
SanDisk Extreme PRO USB 3.2 Gen1 Flash Drive is probably also a good choice, because it's made of Metal and has consistent speeds. Samsung MUF version cannot compete with SanDisk Extreme PRO as it has faster write speed sustainability over 150-200MBps (after dropping the speed). I think you should have reviewed that too. It's Type-A USB drive.hubick - Monday, July 11, 2022 - link
Came here to say this. I'm confused if the SanDisk Extreme PRO USB 3.2 supports UASP/Trim or not (I've seen several reports saying not), and would like to see a review covering that.erinadreno - Tuesday, July 12, 2022 - link
I had two of them and they certainly don't support UASP. They use internal disk driver like sata devices. As for trim, I guess you had to do it manually via optimize in Windows or some cli in linuxshort-n-round - Monday, July 11, 2022 - link
I may have missed it, but did you check to see what speed the device was connected at with something like USBTreeView?abufrejoval - Thursday, July 14, 2022 - link
I’m not quite sure if I should blame it on my first own floppy based computers or the PDP-11/34 with its 10MB swappable hard disks that I earned my first IT money on, but I’ve always gone for swappable storage, including 5 ¼” SyQuest or even 3 ½ magneto optical disks, just for the flexibility and ease of doing backups.Over the last years that was mostly hot-swap tray-less 2.5” drive bays and SATA SSDs, so NVMe was really a bit of a bother, especially once it became the only option in notebooks. I’ve tried basically every USB and Thunderbolt variant for SATA-SSD and NVMe and they typically came up way short. Some wouldn’t even retain the SSD characteristics (no TRIM), but even the Thunderbolt variant turned out to only pass two lanes of PCIe 3.0 on, which halved the Samsung 970 Evo Plus performance.
USB sticks were nothing but toys or “tape” for the longest time, but when I read your original Data Traveler Review, I decided to give it a try and bought a pair of 250GB units, especially since they were the same price as the fastest 128GB SanDisk units I’d used before, which performed at SATA levels.
They have lived up to everything you said and deliver practically identical performance to the 970 Evo Plus on Thunderbolt, at a vastly more convenient form factor and total price point. For anything with a type USB-A connector, I use a simple passive 4cm/1.5inch USB-C to USB-A plug converter.
They are wonderfully light, stunningly low-power for the performance (which *is* important when laptops run on batteries) and my only grief is that they are ever so slightly too wide (about a millimeter), so two of them don’t fit side-by-side into a notebook.
I’ve come to use them like removable hard disks, install full operating systems on them or only use them as data dumps. About the only thing I haven’t yet done yet is to use them in a RAID set, for which they have one critical quality: the backside is nicely flat and not riffled so a thermoprinter sticker with a disk label just fits perfectly on there. Without that, it’s just way to easy to lose track of what’s what.
Flaming jizz - Sunday, July 17, 2022 - link
Why do we have to choose between a type a and a type c? Why can't we have both on the same device.I know there are adapters but it's just another piece that can get lost.