Intel SSD 750 PCIe SSD Review: NVMe for the Client
by Kristian Vättö on April 2, 2015 12:00 PM ESTAnandTech Storage Bench - Heavy
While The Destroyer focuses on sustained and worst-case performance by hammering the drive with nearly 1TB worth of writes, the Heavy trace provides a more typical enthusiast and power user workload. By writing less to the drive, the Heavy trace doesn't drive the SSD into steady-state and thus the trace gives us a good idea of peak performance combined with some basic garbage collection routines.
| AnandTech Storage Bench - Heavy | ||||||||||||
| Workload | Description | Applications Used | ||||||||||
| Photo Editing | Import images, edit, export | Adobe Photoshop | ||||||||||
| Gaming | Pllay games, load levels | Starcraft II, World of Warcraft | ||||||||||
| Content Creation | HTML editing | Dreamweaver | ||||||||||
| General Productivity | Browse the web, manage local email, document creation, application install, virus/malware scan | Chrome, IE10, Outlook, Windows 8, AxCrypt, uTorrent, AdAware | ||||||||||
| Application Development | Compile Chromium | Visual Studio 2008 | ||||||||||
The Heavy trace drops virtualization from the equation and goes a bit lighter on photo editing and gaming, making it more relevant to the majority of end-users.
| AnandTech Storage Bench - Heavy - Specs | ||||||||||||
| Reads | 2.17 million | |||||||||||
| Writes | 1.78 million | |||||||||||
| Total IO Operations | 3.99 million | |||||||||||
| Total GB Read | 48.63 GB | |||||||||||
| Total GB Written | 106.32 GB | |||||||||||
| Average Queue Depth | ~4.6 | |||||||||||
| Focus | Peak IO, basic GC routines | |||||||||||
The Heavy trace is actually more write-centric than The Destroyer is. A part of that is explained by the lack of virtualization because operating systems tend to be read-intensive, be that a local or virtual system. The total number of IOs is less than 10% of The Destroyer's IOs, so the Heavy trace is much easier for the drive and doesn't even overwrite the drive once.
| AnandTech Storage Bench - Heavy - IO Breakdown | |||||||||||
| IO Size | <4KB | 4KB | 8KB | 16KB | 32KB | 64KB | 128KB | ||||
| % of Total | 7.8% | 29.2% | 3.5% | 10.3% | 10.8% | 4.1% | 21.7% | ||||
The Heavy trace has more focus on 16KB and 32KB IO sizes, but more than half of the IOs are still either 4KB or 128KB. About 43% of the IOs are sequential with the rest being slightly more full random than pseudo-random.
| AnandTech Storage Bench - Heavy - QD Breakdown | ||||||||||||
| Queue Depth | 1 | 2 | 3 | 4-5 | 6-10 | 11-20 | 21-32 | >32 | ||||
| % of Total | 63.5% | 10.4% | 5.1% | 5.0% | 6.4% | 6.0% | 3.2% | 0.3% | ||||
In terms of queue depths the Heavy trace is even more focused on very low queue depths with three fourths happening at queue depth of one or two.
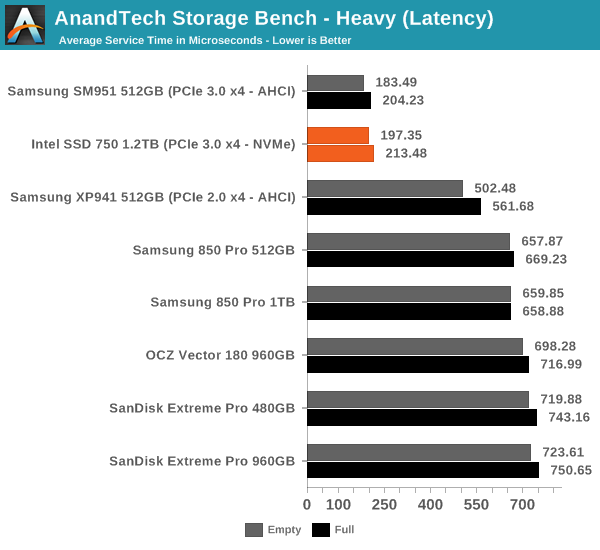
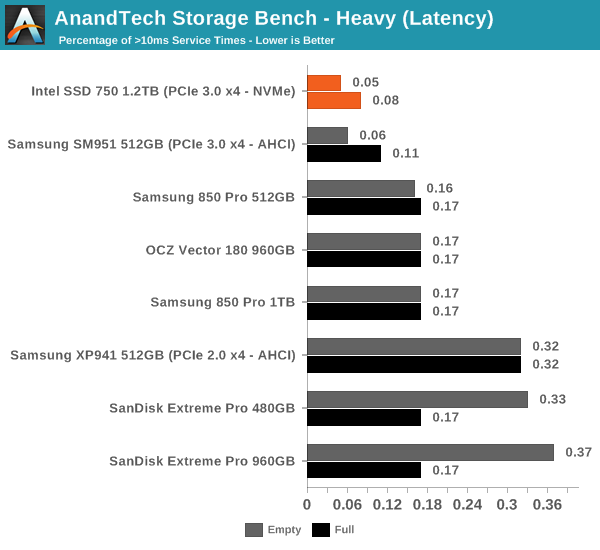
I'm reporting the same performance metrics as in The Destroyer benchmark, but I'm running the drive in both empty and full states. Some manufacturers tend to focus intensively on peak performance on an empty drive, but in reality the drive will always contain some data. Testing the drive in full state gives us valuable information whether the drive loses performance once it's filled with data.
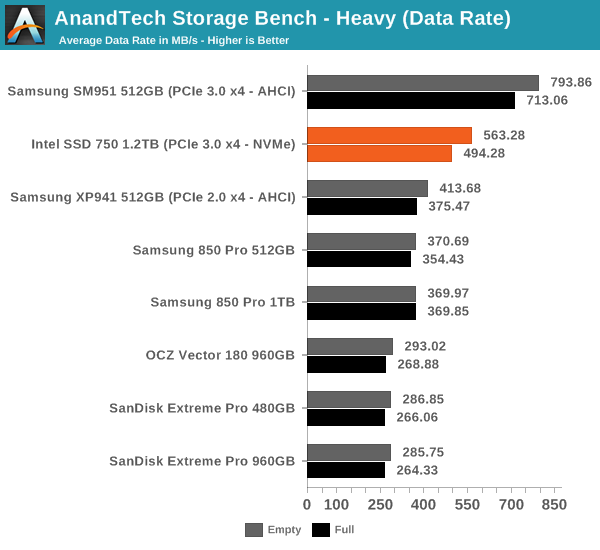
It turns out that the SM951 is overall faster than the SSD 750 in our heavy trace as it beats the SSD 750 in both data rate and average latency. I was expecting the SSD 750 to do better due to NVMe, but it looks like the SM951 is a very capable drive despite lacking NVMe (although there appears to be an NVMe version too after all). On the other hand, I'm not too surprised because the SM951 has specifically been built for client workloads, whereas the SSD 750 has an enterprise heritage and even on the client side it's designed for the most intensive workloads.


132 Comments
View All Comments
Ethos Evoss - Saturday, April 4, 2015 - link
http://www.thessdreview.com/our-reviews/plextor-m6...Brazos - Monday, April 6, 2015 - link
Does the Plextor use NVMe?Sushisamurai - Saturday, April 4, 2015 - link
I mentioned this on twitter with you already, but Dead Rising 3 on a HDD versus a NVMe SSD comparison would be nice :) would save me the work of doing it and testing it on my own :pAntonAM - Monday, April 6, 2015 - link
I don't understand why both drives have the same endurance if one of them have 3 times more flash? Is it endurance of something else?emn13 - Monday, April 6, 2015 - link
The endurance figure is also *really* low compared to other drives - it works out to around 128TB of total writes - that's on the order of 50 times less than an 850Pro (which is slightly smaller).I'm hoping this is just a really stingy guarrantee, and not representative of the actual drive - otherwise I'd really, recommend against using it.
I mean, running the anandtech destroyer benchmark with its close to 1TB of writes would use up your write-allowance for the next two weeks (put another way, it's cost around 10$ in relation to the 1k drive cost).
edved - Tuesday, April 7, 2015 - link
So how does this compare to the Kingstone HyperX Predator that was recently reviewed and I recently purchased?!eliz82 - Tuesday, April 7, 2015 - link
any chance of testing Kingston HyperX Predator PCIe SSD ?SanX - Tuesday, April 7, 2015 - link
Put down the drain all flash trash and start making full power loss protected ramdrives with flash/harddrive backup. Would be cheap by this time if not slow selfdedtroying flash garbage lying on the way.gospadin - Tuesday, April 7, 2015 - link
In other words, 100x the cost for a marginal improvement in performance?Rustang - Wednesday, April 8, 2015 - link
1) Why would you post a review of a Intel SSD 750 PCIe SSD solution without benchmarking it against the other state of the art Intel PCIe SSD Intel DC P3700 solution?2) Why would you put up sequential/random read/write graphs with pull-downs to display the different hardware results instead of efficiently putting all of the hardware results on ONE graph?