MyDigitalSSD BP4 2.5" & mSATA (240GB) Review
by Kristian Vättö on April 3, 2013 11:13 AM ESTPerformance Consistency
In our Intel SSD DC S3700 review Anand introduced a new method of characterizing performance: looking at the latency of individual operations over time. The S3700 promised a level of performance consistency that was unmatched in the industry, and as a result needed some additional testing to show that. The reason we don't have consistent IO latency with SSDs is because inevitably all controllers have to do some amount of defragmentation or garbage collection in order to continue operating at high speeds. When and how an SSD decides to run its defrag and cleanup routines directly impacts the user experience. Frequent (borderline aggressive) cleanup generally results in more stable performance, while delaying that can result in higher peak performance at the expense of much lower worst case performance. The graphs below tell us a lot about the architecture of these SSDs and how they handle internal defragmentation.
To generate the data below I took a freshly secure erased SSD and filled it with sequential data. This ensures that all user accessible LBAs have data associated with them. Next I kicked off a 4KB random write workload across all LBAs at a queue depth of 32 using incompressible data. I ran the test for just over half an hour, no where near what we run our steady state tests for but enough to give me a good look at drive behavior once all spare area filled up.
I recorded instantaneous IOPS every second for the duration of the test. I then plotted IOPS vs. time and generated the scatter plots below. Each set of graphs features the same scale. The first two sets use a log scale for easy comparison, while the last set of graphs uses a linear scale that tops out at 40K IOPS for better visualization of differences between drives.
The high level testing methodology remains unchanged from our S3700 review. Unlike in previous reviews however, I did vary the percentage of the drive that I filled/tested depending on the amount of spare area I was trying to simulate. The buttons are labeled with the advertised user capacity had the SSD vendor decided to use that specific amount of spare area. If you want to replicate this on your own all you need to do is create a partition smaller than the total capacity of the drive and leave the remaining space unused to simulate a larger amount of spare area. The partitioning step isn't absolutely necessary in every case but it's an easy way to make sure you never exceed your allocated spare area. It's a good idea to do this from the start (e.g. secure erase, partition, then install Windows), but if you are working backwards you can always create the spare area partition, format it to TRIM it, then delete the partition. Finally, this method of creating spare area works on the drives we've tested here but not all controllers may behave the same way.
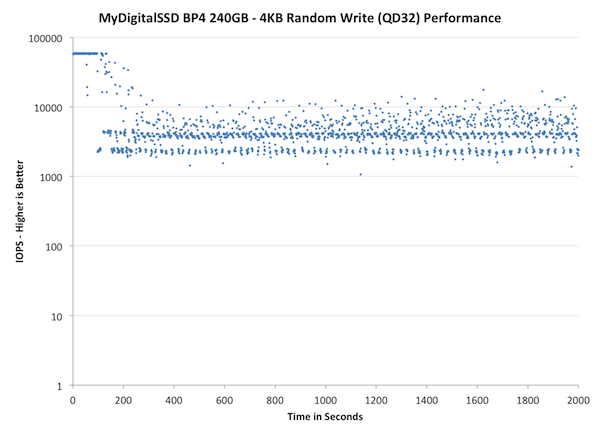
The first set of graphs shows the performance data over the entire 2000 second test period. In these charts you'll notice an early period of very high performance followed by a sharp dropoff. What you're seeing in that case is the drive allocating new blocks from its spare area, then eventually using up all free blocks and having to perform a read-modify-write for all subsequent writes (write amplification goes up, performance goes down).
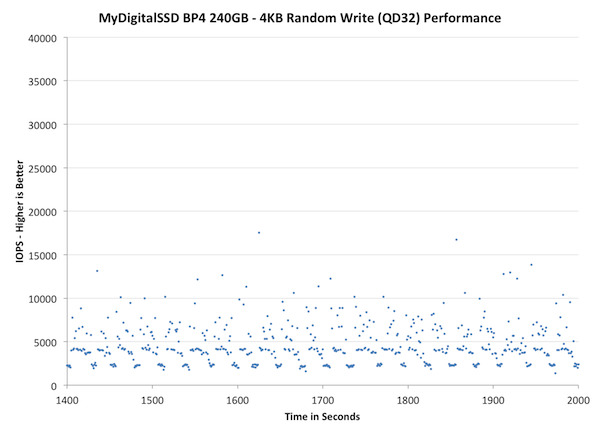
The second set of graphs zooms in to the beginning of steady state operation for the drive (t=1400s). The third set also looks at the beginning of steady state operation but on a linear performance scale. Click the buttons below each graph to switch source data.
| Impact of Spare Area | ||||||||
| MyDigitalSSD BP4 240GB | MyDigitalSSD BP4 mSATA 240GB | MyDigitalSSD BP3 mSATA 256GB | Plextor M5M 256GB | Intel SSD 525 240GB | Samsung SSD 840 Pro 256GB | |||
| Default | ||||||||
| 25% Spare Area | ||||||||
The BP4 takes a big step forward in terms of IO consistency. There's more OP by default, that's for sure, but even if you look at the BP3 with 25% OP results, the improvement is still huge. Instead of playing in the 100-1,000 IOPS field, the BP4 stays between 1,000 and 10,000 IOPS throughout the test. What you can't actually see in the logarithmic graphs are the data points where BP3's IOPS is zero. There are plenty of those and sometimes the BP3 stopped for 10-20 consecutive seconds. I'll be honest here and say that that's very bad because it basically means the SSD isn't completing any IO requests from the host for that period, which means your whole system will be waiting for the drive. Even with 25% OP, there were moments when the BP3 stopped completely, though fortunately the durations were only 1-5 seconds instead of 20.
Another interesting point is that the 2.5" and mSATA BP4s behave quite differently. The 2.5" obviously has higher average IOPS but the mSATA is more consistent. If you look at the default OP mSATA graph, it's almost like a straight line once steady state is reached, and performance actually improves over time. The 2.5" BP4 is more inconsistent and its garbage collection seems to behave differently in general. Basically, there are periods of lower IOPS, where the drive is most likely doing garbage collection, and then you got peaks where performance increases temporarily until the drive has to slow down to do garbage collection again.
Neither of the approaches is worse than the other and I should probably note that the mSATA BP4 has a newer firmware (v4.6 instead of v4.3 found in the 2.5"). MyDigitalSSD told me that the firmware 4.6 only addresses some compatibility issues and 2.5" BP4 should currently ship with 4.6 as well, so I doubt that's the reason for the difference. The 2.5" BP4 has higher overall throughput so the drive will also be in more fragmented state, so it's possible that the higher fragmentation simply puts the drive into a state where it has to slow down every once in a while to keep the performance. Anyway, the drop is rather small (I've seen some other SSDs dropping much more) so I wouldn't worry about it.

| Impact of Spare Area | ||||||||
| MyDigitalSSD BP4 240GB | MyDigitalSSD BP4 mSATA 240GB | MyDigitalSSD BP3 mSATA 256GB | Plextor M5M 256GB | Intel SSD 525 240GB | Samsung SSD 840 Pro 256GB | |||
| Default | ||||||||
| 25% Spare Area | ||||||||
While the 2.5" BP4 has much higher out-of-the-box IOPS, the steady state performance is very close to the mSATA version. The 2.5" does have peaks in the 10,000 IOPS range but the baseline performance for both SSDs is around 2,500-5,000 IOPS. The non-logarithmic graph also really shows how the BP3 suffers—the performance is literally zero IOPS throughout the steady-state period.
| Impact of Spare Area | ||||||||
| MyDigitalSSD BP4 240GB | MyDigitalSSD BP4 mSATA 240GB | MyDigitalSSD BP3 mSATA 256GB | Plextor M5M 256GB | Intel SSD 525 240GB | Samsung SSD 840 Pro 256GB | |||
| Default | ||||||||
| 25% Spare Area | ||||||||


35 Comments
View All Comments
watersb - Wednesday, April 3, 2013 - link
Excellent. I shall purchase the 512GB!Death666Angel - Wednesday, April 3, 2013 - link
Well, the availability in Europe seems crappy (only one UK shop 35% higher priced than the Samsung 840). I don't understand why the mSATA version is so under performing either. All-in-all, not something I would buy.MyDigitalSSD - Thursday, April 4, 2013 - link
mSATA uses 4 channels (can only fit 4 chips on board) on an 8 channel controller while the 2.5" uses all 8 channels. You will never notice a difference in daily use.Oxford Guy - Thursday, April 4, 2013 - link
"The Samsung SSD 840 has really been the only budget drive without any serious drawbacks."HardOCP's review of the 120 GB TLC drive found that its read speed plummeted because of testing, indicating that the low lifespan of the TLC NAND can be a problem. That is in addition to not very impressive write speed.
MyDigitalSSD - Thursday, April 4, 2013 - link
Good point. We only use the best Toshiba MLC toggle (synch) flash. Our BP4 performance over time will not deteriorate at all. This drive is a great alternative to Samsung for sure.pcrusan - Thursday, April 4, 2013 - link
Where is the 240GB BP4 at $160? I find it at $180 and $200.MyDigitalSSD - Thursday, April 4, 2013 - link
Low stock is causing the temporary pricing fluctuations. There is a serious flash shortage right now.MyDigitalSSD - Thursday, April 4, 2013 - link
They are in stock at MyDigitalDiscount.com at 159.99!AKFlyerFan - Friday, April 5, 2013 - link
I just ordered one of the last two reported in stock there, so we'll see how good they are when it comes in and I get it up and running..pcrusan - Tuesday, April 9, 2013 - link
Now $179.99.