The AMD Ryzen 9 7900, Ryzen 7 7700, and Ryzen 5 7600 Review: Zen 4 Efficiency at 65 Watts
by Gavin Bonshor on January 9, 2023 9:00 AM ESTCPU Benchmark Performance: Power And Office
Our previous sets of ‘office’ benchmarks have often been a mix of science and synthetics, so this time we wanted to keep our office section purely on real-world performance. We've also incorporated our power testing into this section too.
The biggest update to our Office-focused tests for 2023 and beyond include UL's Procyon software, which is the successor to PCMark. Procyon benchmarks office performance using Microsoft Office applications, as well as Adobe's Photoshop/Lightroom photo editing software, and Adobe Premier Pro's video editing capabilities. Due to issues with UL Procyon and the video editing test, we haven't been able to properly run these, but once we identify a fix with UL, we will re-test each chip.
We are using DDR5 memory on the 12th and 13th Gen Core parts, as well as the Ryzen 7000 series, at the following settings:
- DDR5-5600B CL46 - Intel 13th Gen
- DDR5-5200 CL44 - Ryzen 7000
- DDR5-4800 (B) CL40 - Intel 12th Gen
All other CPUs such as Ryzen 5000 and 3000 were tested at the relevant JEDEC settings as per the processor's individual memory support with DDR4.
Power
The nature of reporting processor power consumption has become, in part, a bit of a nightmare. Historically the peak power consumption of a processor, as purchased, is given by its Thermal Design Power (TDP, or PL1). For many markets, such as embedded processors, that value of TDP still signifies the peak power consumption. For the processors we test at AnandTech, either desktop, notebook, or enterprise, this is not always the case.
Modern high-performance processors implement a feature called Turbo. This allows, usually for a limited time, a processor to go beyond its rated frequency. Exactly how far the processor goes depends on a few factors, such as the Turbo Power Limit (PL2), whether the peak frequency is hard coded, the thermals, and the power delivery. Turbo can sometimes be very aggressive, allowing power values 2.5x above the rated TDP.
AMD and Intel have different definitions for TDP that are, broadly speaking, applied the same. The difference comes from turbo modes, turbo limits, turbo budgets, and how the processors manage that power balance. These topics are 10000-12000 word articles in their own right, and we’ve got a few articles worth reading on the topic.
- Why Intel Processors Draw More Power Than Expected: TDP and Turbo Explained
- Talking TDP, Turbo and Overclocking: An Interview with Intel Fellow Guy Therien
- Reaching for Turbo: Aligning Perception with AMD’s Frequency Metrics
- Intel’s TDP Shenanigans Hurts Everyone
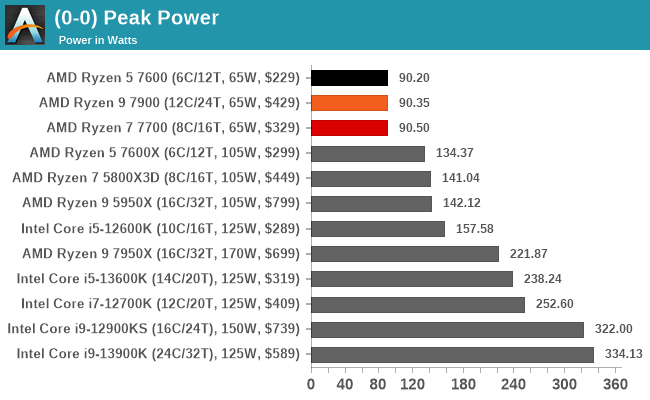
Regarding peak power, all three AMD's Ryzen 7000 65 W series for desktop topped out around 90 W under full load. This figure of 90 W was consistent throughout our power testing, which is within a couple Watts of AMD's Power Package Tracking (PPT) limits (~88W).
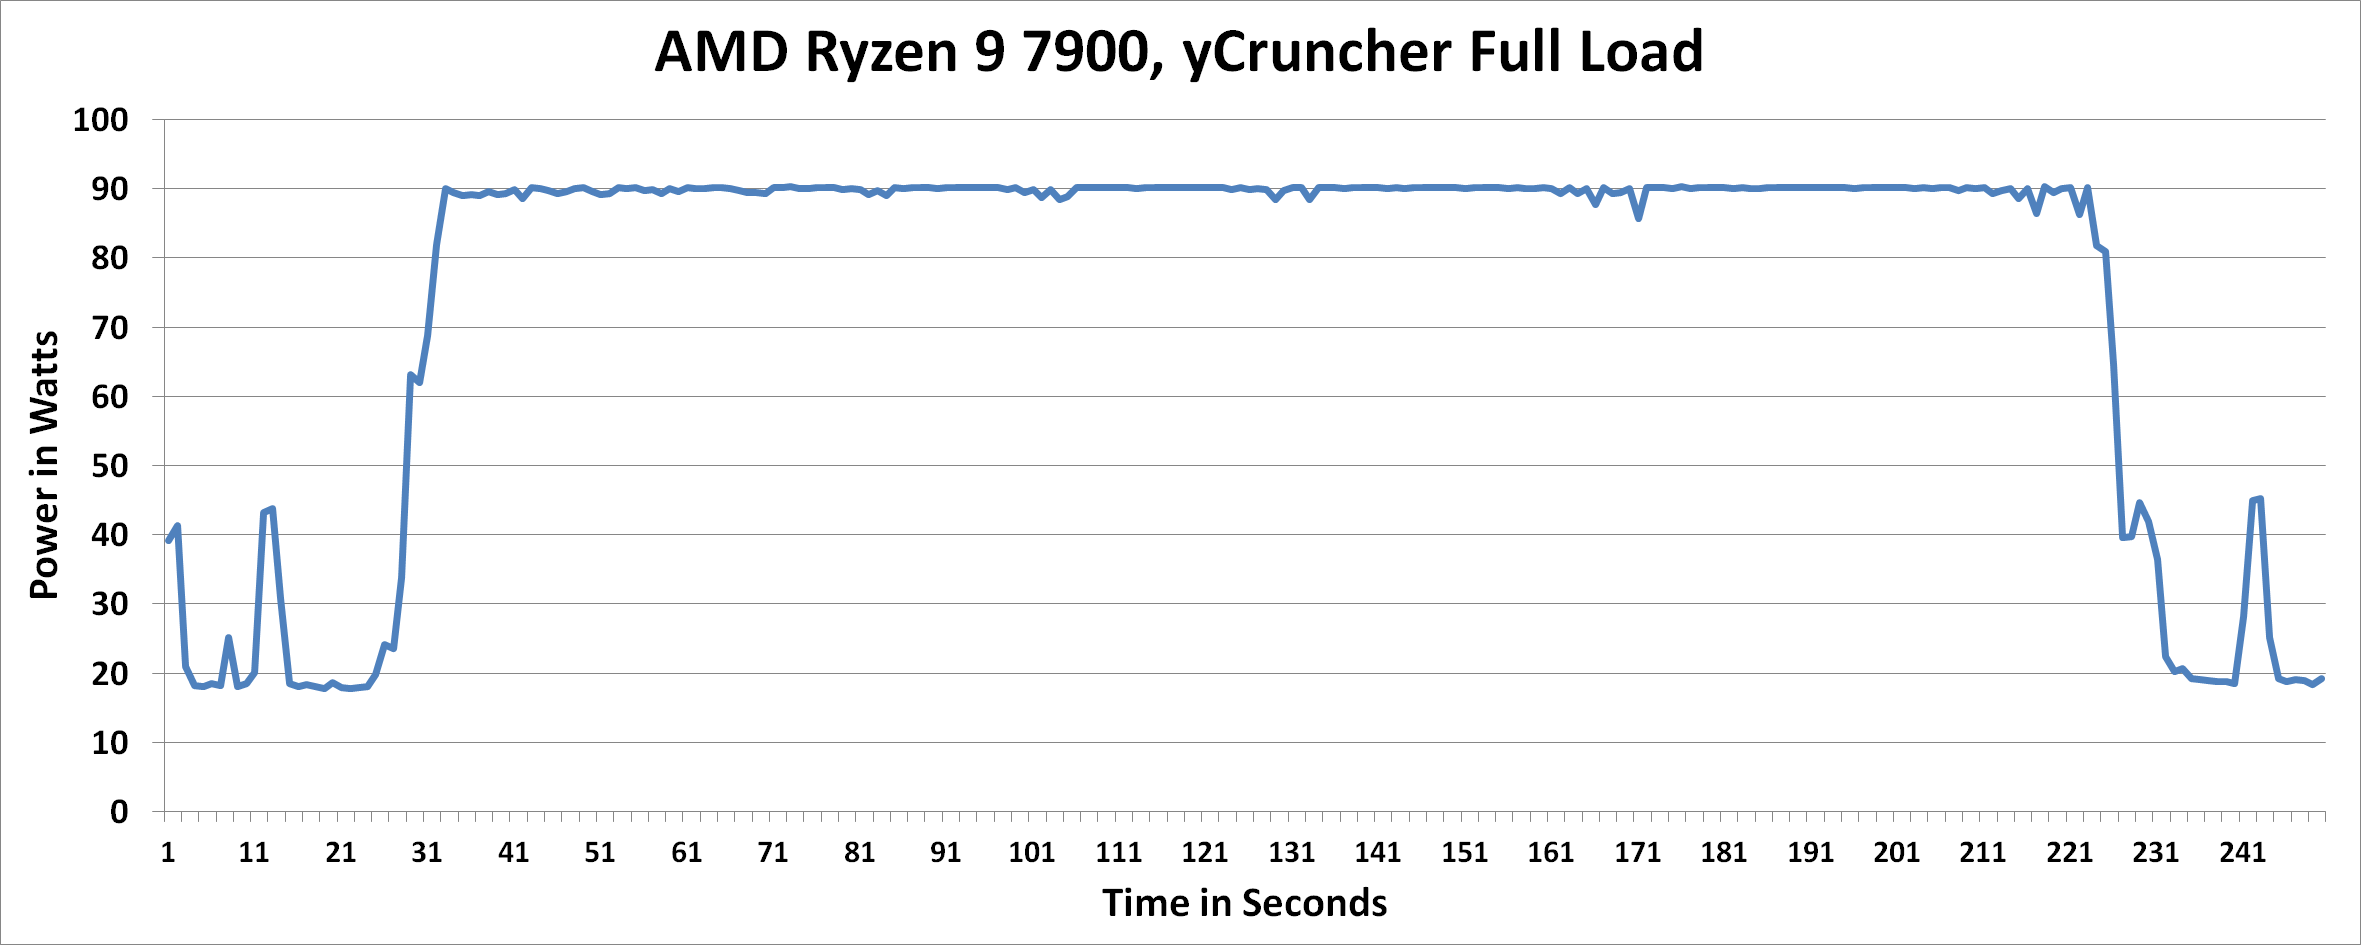
Looking at the power consumption of the Ryzen 9 7900 in more detail, we can see how it behaved under full load when running a workload using yCruncher. As we can see from the above graph, when the workload is called, and strain is placed on the Ryzen 9 7900, it immediately rose to 90 W and remained relatively consistent throughout the benchmark. and remained at the 90 W mark for around 193 seconds.
This was the same duration the benchmark took to complete, meaning that the Ryzne 9 7900 remained at its peak power for the full duration.
Office/Web
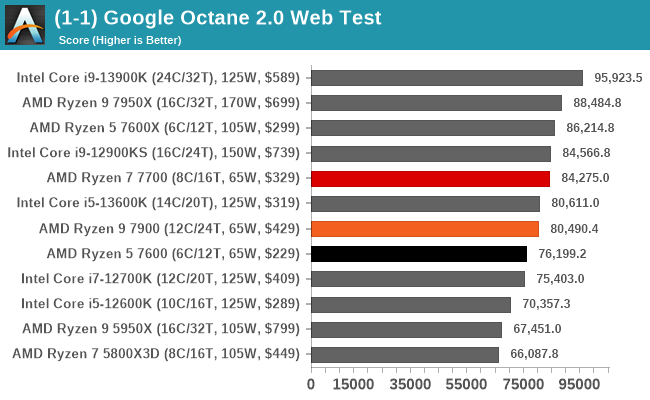
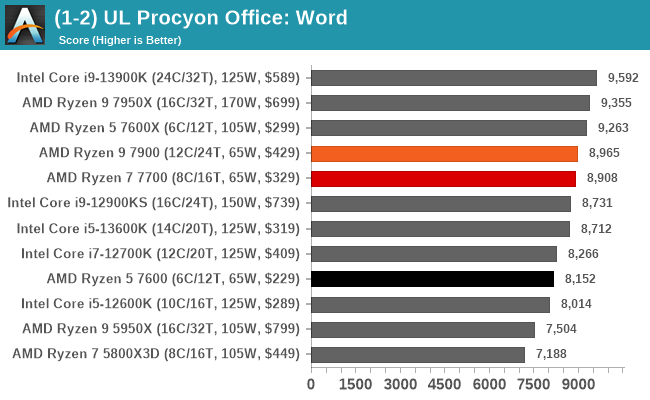
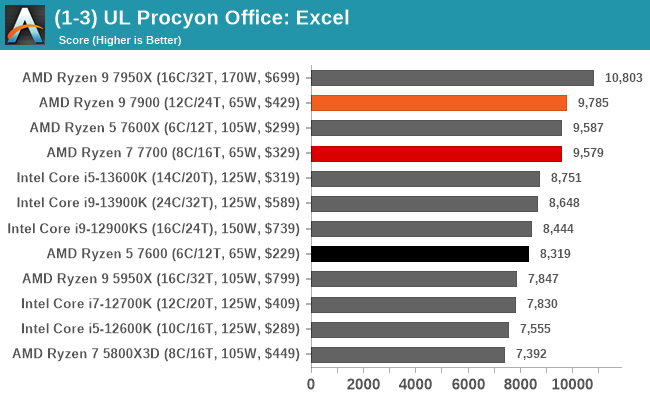
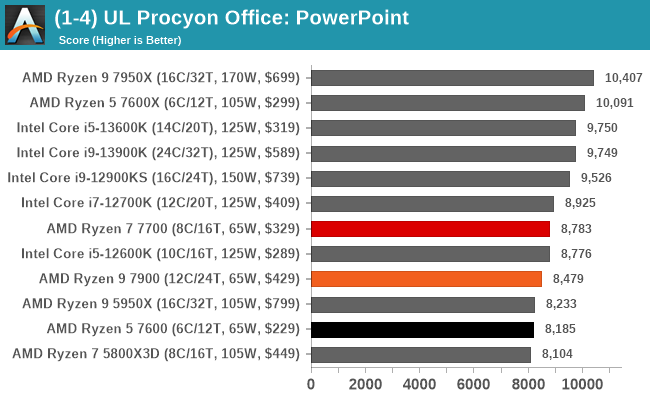
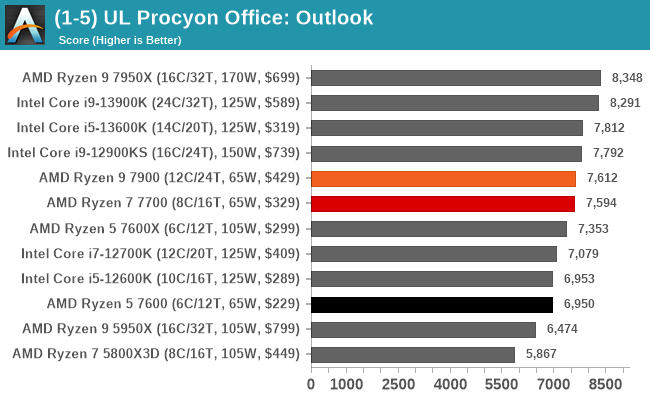
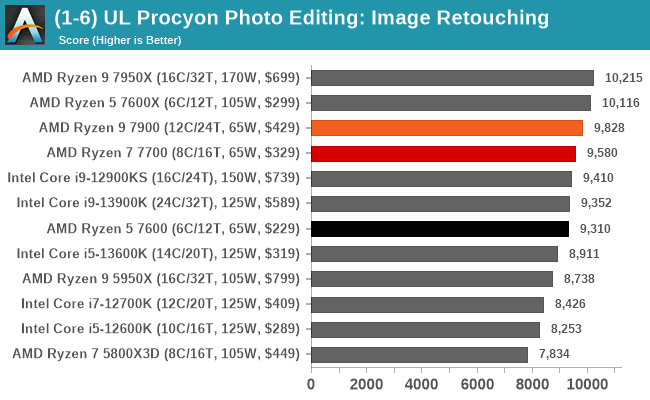
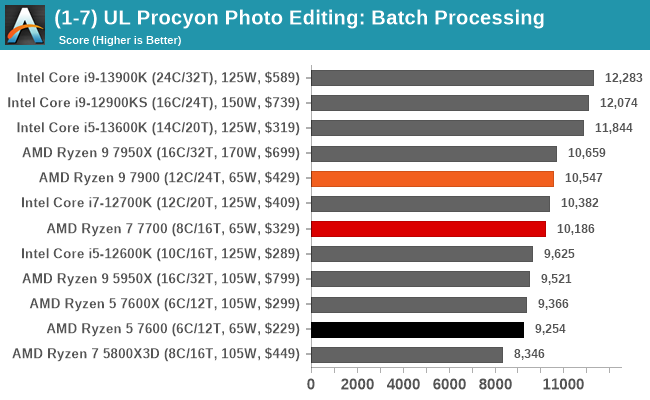
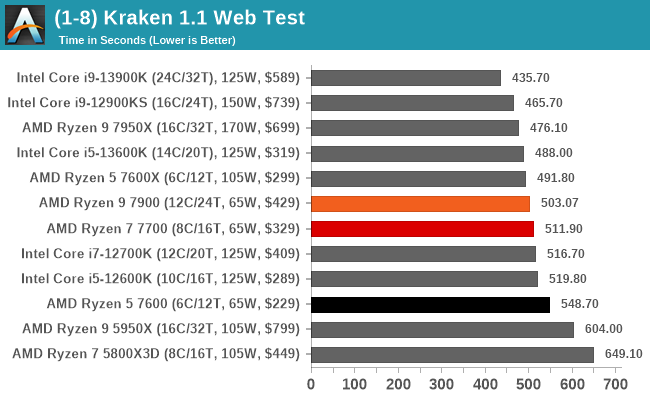
In our office and productivity benchmarks, the AMD Ryzen 9 7900, as expected, performed the best out of the three chips. All three chips in each of the office-based workloads comfortably beat out the Ryzen 9 5950X, which is impressive given the Ryzen 5 7600 is a 6C/12T part at 65 W TDP beating out a much beefier Ryzen 9 5950X that is a 16C/32T part, albeit on an older architecture.


55 Comments
View All Comments
iRacer - Wednesday, February 1, 2023 - link
How do you get V-Ray benchmark values which are 35 to 50% higher than anything that can be seen on the results page?What version of the benchmark are you using?
leavenfish - Sunday, February 5, 2023 - link
Ummm....don't think he ever did the testing update he said he would try to do (but was busy) the weekened after the article came out?Gavin Bonshor - Monday, February 6, 2023 - link
It's coming, don't worry.Gavin Bonshor - Monday, February 6, 2023 - link
It isn't the latest iteration. It's the previous version (4). The critical area to consider is the consistency of the results within the same version.Of course, we will update this benchmark in our next wave to the latest version. If we did this for every benchmark, I would spend 100% of my time testing and 0% writing.
blueryu - Tuesday, February 7, 2023 - link
I'd like to know the idle power consumption of the CPUs. Apparently there is quite a difference at idle between the latest AMD and Intel options but can't seem to find much in the way of tests.