The AMD Ryzen 9 7900, Ryzen 7 7700, and Ryzen 5 7600 Review: Zen 4 Efficiency at 65 Watts
by Gavin Bonshor on January 9, 2023 9:00 AM ESTCPU Benchmark Performance: Power And Office
Our previous sets of ‘office’ benchmarks have often been a mix of science and synthetics, so this time we wanted to keep our office section purely on real-world performance. We've also incorporated our power testing into this section too.
The biggest update to our Office-focused tests for 2023 and beyond include UL's Procyon software, which is the successor to PCMark. Procyon benchmarks office performance using Microsoft Office applications, as well as Adobe's Photoshop/Lightroom photo editing software, and Adobe Premier Pro's video editing capabilities. Due to issues with UL Procyon and the video editing test, we haven't been able to properly run these, but once we identify a fix with UL, we will re-test each chip.
We are using DDR5 memory on the 12th and 13th Gen Core parts, as well as the Ryzen 7000 series, at the following settings:
- DDR5-5600B CL46 - Intel 13th Gen
- DDR5-5200 CL44 - Ryzen 7000
- DDR5-4800 (B) CL40 - Intel 12th Gen
All other CPUs such as Ryzen 5000 and 3000 were tested at the relevant JEDEC settings as per the processor's individual memory support with DDR4.
Power
The nature of reporting processor power consumption has become, in part, a bit of a nightmare. Historically the peak power consumption of a processor, as purchased, is given by its Thermal Design Power (TDP, or PL1). For many markets, such as embedded processors, that value of TDP still signifies the peak power consumption. For the processors we test at AnandTech, either desktop, notebook, or enterprise, this is not always the case.
Modern high-performance processors implement a feature called Turbo. This allows, usually for a limited time, a processor to go beyond its rated frequency. Exactly how far the processor goes depends on a few factors, such as the Turbo Power Limit (PL2), whether the peak frequency is hard coded, the thermals, and the power delivery. Turbo can sometimes be very aggressive, allowing power values 2.5x above the rated TDP.
AMD and Intel have different definitions for TDP that are, broadly speaking, applied the same. The difference comes from turbo modes, turbo limits, turbo budgets, and how the processors manage that power balance. These topics are 10000-12000 word articles in their own right, and we’ve got a few articles worth reading on the topic.
- Why Intel Processors Draw More Power Than Expected: TDP and Turbo Explained
- Talking TDP, Turbo and Overclocking: An Interview with Intel Fellow Guy Therien
- Reaching for Turbo: Aligning Perception with AMD’s Frequency Metrics
- Intel’s TDP Shenanigans Hurts Everyone
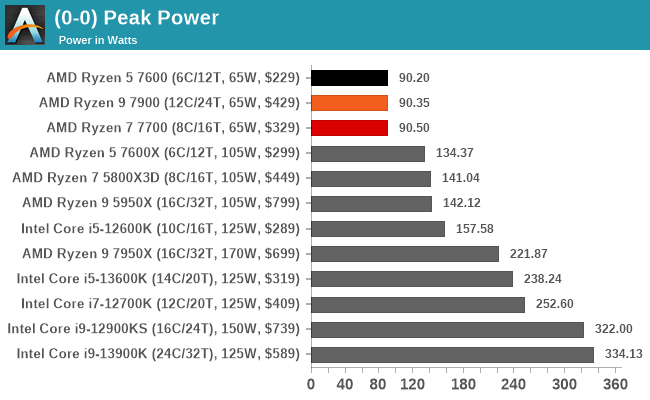
Regarding peak power, all three AMD's Ryzen 7000 65 W series for desktop topped out around 90 W under full load. This figure of 90 W was consistent throughout our power testing, which is within a couple Watts of AMD's Power Package Tracking (PPT) limits (~88W).
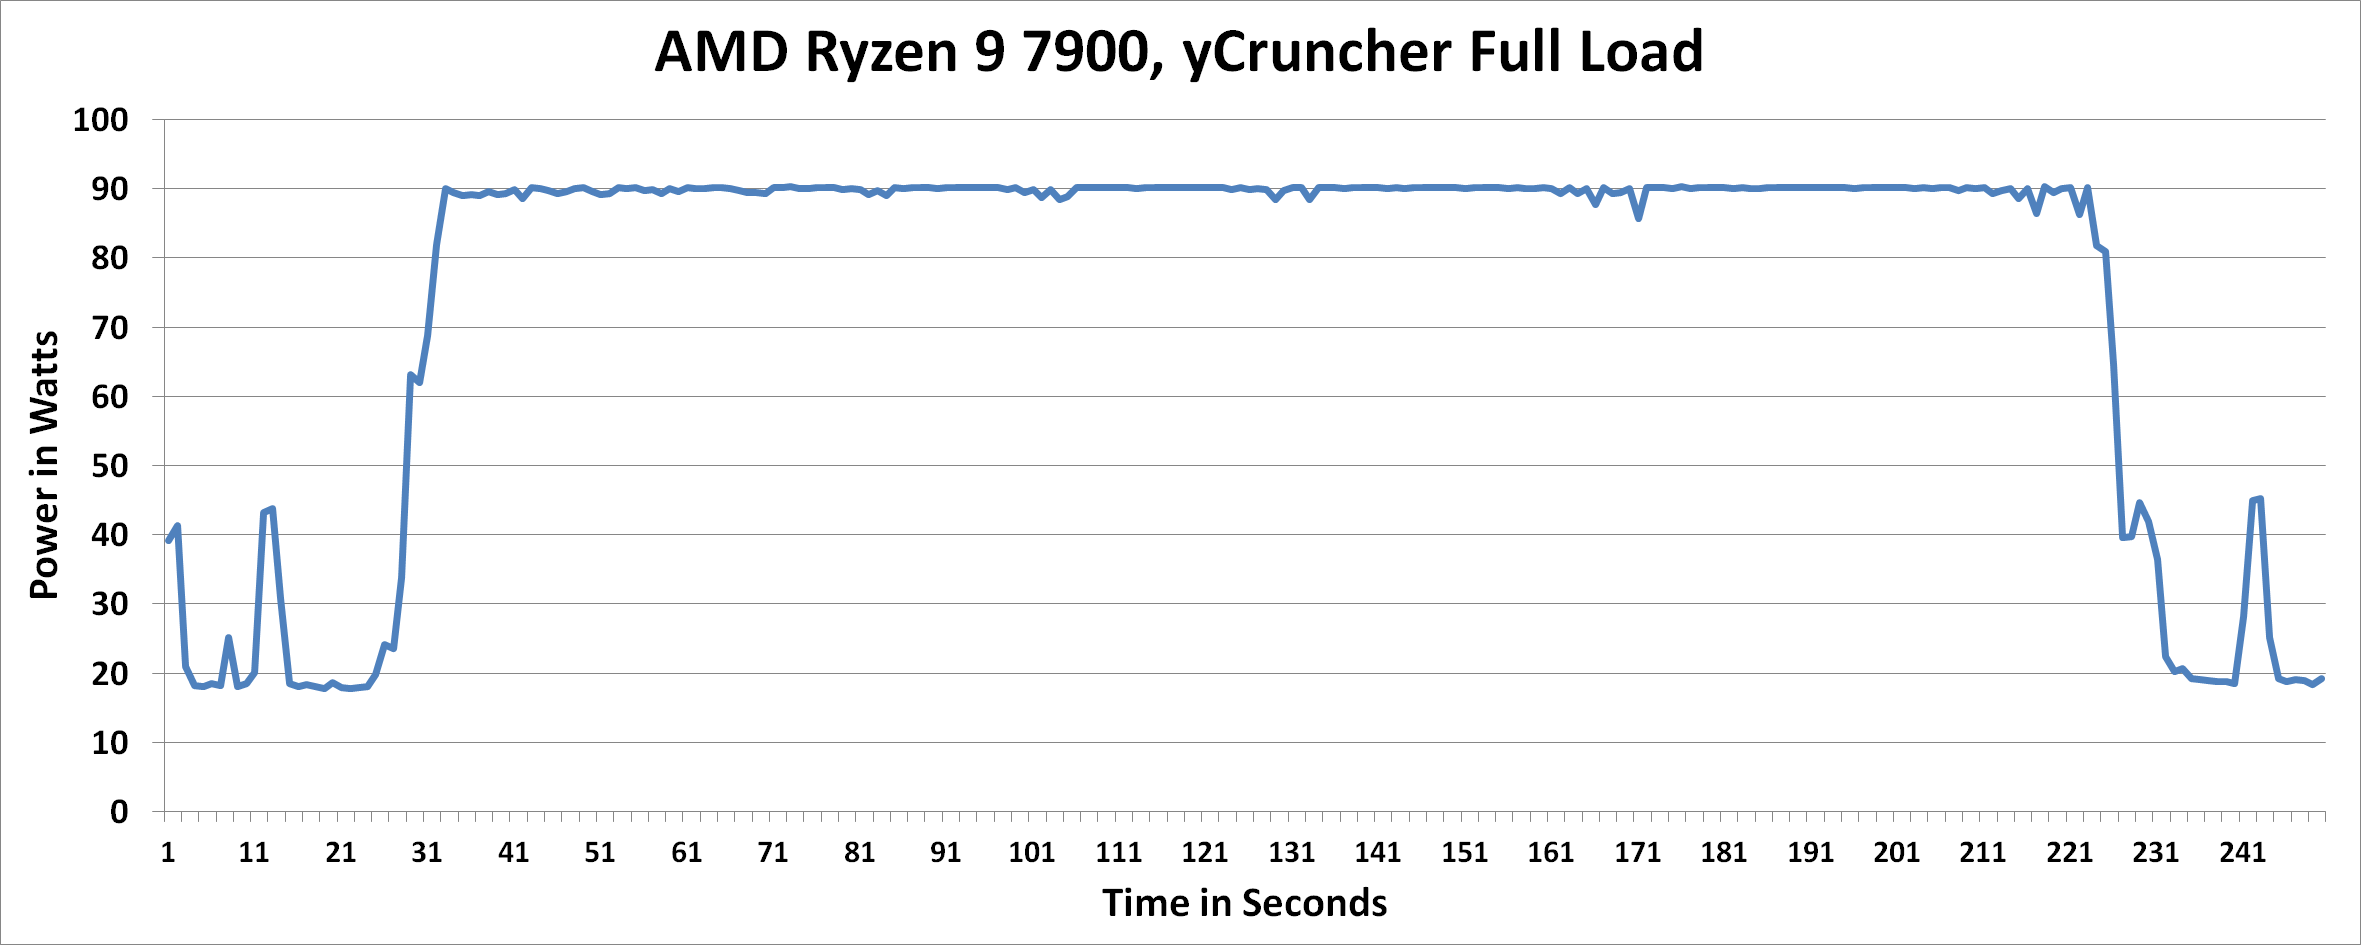
Looking at the power consumption of the Ryzen 9 7900 in more detail, we can see how it behaved under full load when running a workload using yCruncher. As we can see from the above graph, when the workload is called, and strain is placed on the Ryzen 9 7900, it immediately rose to 90 W and remained relatively consistent throughout the benchmark. and remained at the 90 W mark for around 193 seconds.
This was the same duration the benchmark took to complete, meaning that the Ryzne 9 7900 remained at its peak power for the full duration.
Office/Web
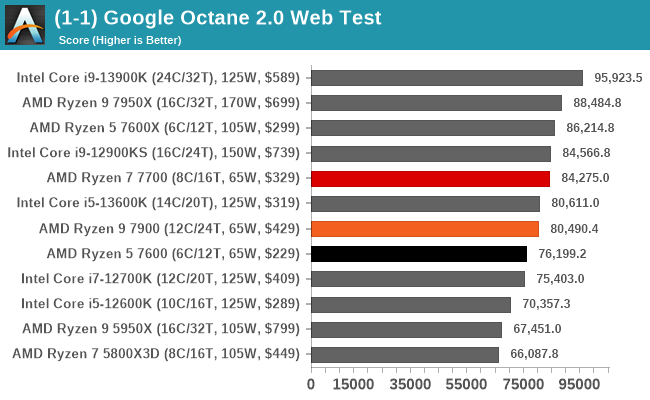
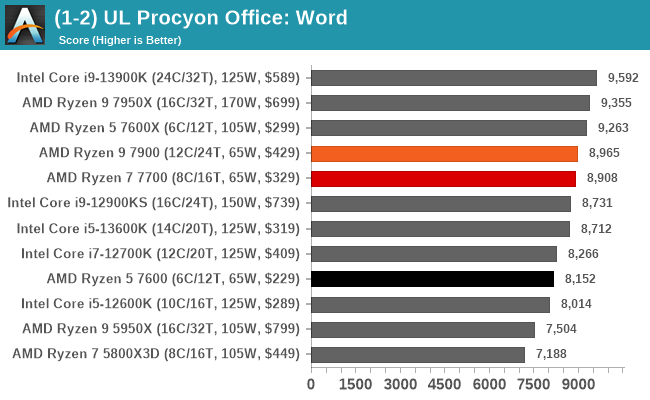
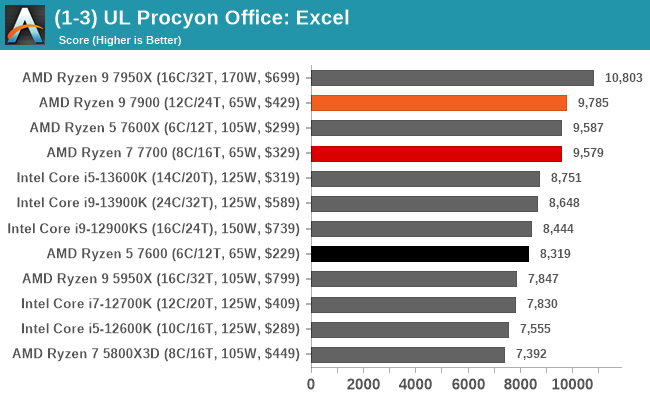
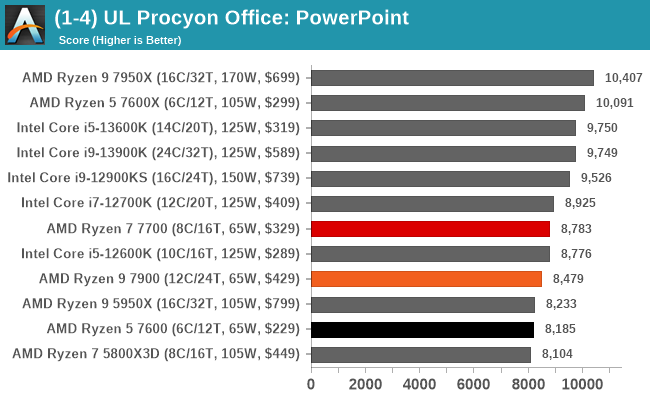
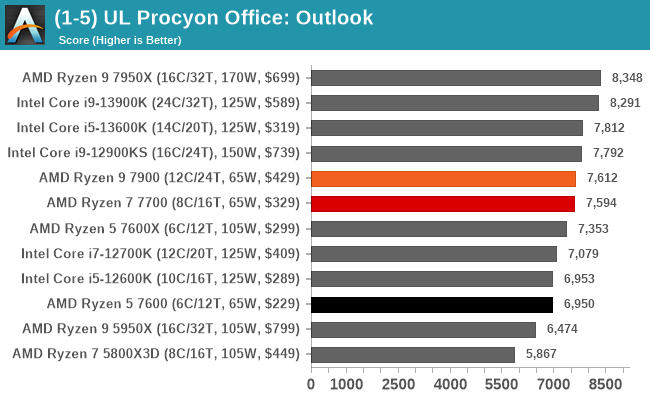
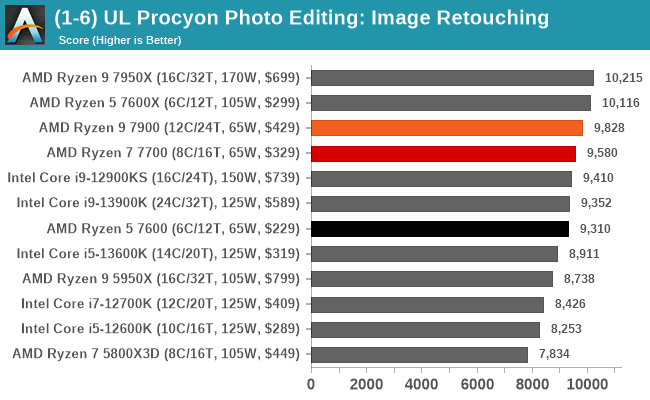
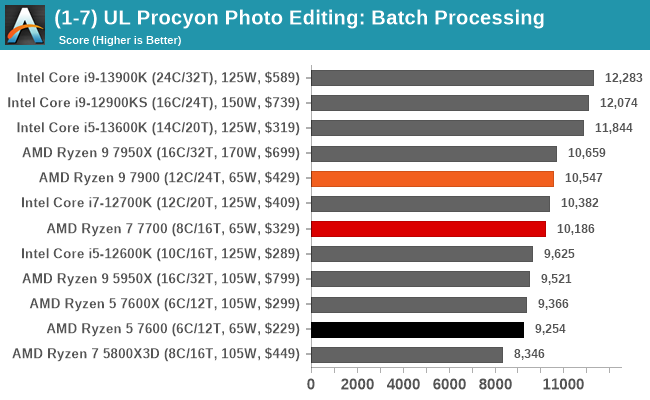
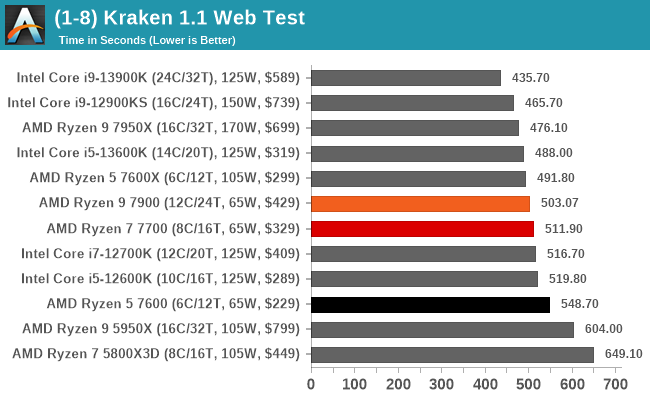
In our office and productivity benchmarks, the AMD Ryzen 9 7900, as expected, performed the best out of the three chips. All three chips in each of the office-based workloads comfortably beat out the Ryzen 9 5950X, which is impressive given the Ryzen 5 7600 is a 6C/12T part at 65 W TDP beating out a much beefier Ryzen 9 5950X that is a 16C/32T part, albeit on an older architecture.


55 Comments
View All Comments
Zucker2k - Wednesday, January 11, 2023 - link
https://www.anandtech.com/show/17418/amd-corrects-...65x1.35 =87.75ppt
105x1.35=141.75ppt
120x1.35=162ppt
125x1.35=168.75ppt
170x1.35=229.5ppt
juhatus - Monday, January 9, 2023 - link
"Looking at the Ryzen 9 7900, it marginally beats out the Ryzen 9 _7950X_ and sits" - Typo, should be 5950X, above borderlands 3 test on conclusion page.Gavin Bonshor - Monday, January 9, 2023 - link
Thank you for spotting that!MadAd - Monday, January 9, 2023 - link
Did I miss the single core performance test?djsvetljo - Monday, January 9, 2023 - link
I am concerned about Zen4 minimum power draw (idle). Judging by graphs on page 2, it seems like CPU consumes 20 watt on idle???Going back to the Zen4 X comparison vs 13th gen, Intel seems to have advantage at idle. Planning to update home server that sits on idle or very low load 80% of the day, but needs to be on 24/7. I eventually am planing to run VMs on it (rare gaming with GPU pass thru). Thoughts?
duploxxx - Tuesday, January 10, 2023 - link
thoughts? you are creating a wacko system. one site you want to have low low idle, and than intel is better although the latest generation is less difference... its not the cpu, its the total package with pci-e5 etc that is upping the idle power. on the other side you want GPU power which eats already 50% of your total idle power. so the diff between intel and amd will now be only way less vs total idle.. on top for VM you should have an AMD multicore for sure. my advise? wait for the 7000 APU it might fit both your needs.kpb321 - Monday, January 9, 2023 - link
Is it just me or do the 7600x and 7700x just seem like bad deals compared to the newly released chips. $30 moves you up to the 7700 or 7900 respectively with the same rated boost clocks for ST task. Lower base clocks will hurt but the additional cores will help compensate in most MT situations. The 7700 beats the 7600x in many of the multi-threaded tests and does it for a small premium and while using a lot less power in the process.steveofwa - Monday, January 9, 2023 - link
Seems like there is no reason for the "x" versions to exist. They can have their non X with good power efficiency, and the x3d for performance.Byte - Tuesday, January 10, 2023 - link
X is now the "founders" edition where rather than get discounts like kickstarter, you pay for the privilege for getting it first. Nvidia did this with the 2080Ti FE being $1200 whereas msrp was $999. They saw it work well so everyone taking a page. Ryzen traditionally launched with non-X and that was the go to. The X is mostly for emotional reasons which plays a bigger factor in marketing than you think. Most people will never lower themselves to a x700 series card for instance. That is why nvidia did two 4080s in the beginning but backtracked. Wrong move.AndrewJacksonZA - Monday, January 9, 2023 - link
Hi. For "(3-3) Dolphin 5.0 Render Test" you have the test results in your Bench different to the test results in the graph.In the graph:
Intel Core i9-12900KS = 182.2
In your Bench:
Intel Core i9-12900KS with DDR5 = 169
Intel Core i9-12900K with DDR4 = 181
Also, according to your Bench, for "(3-4c) Factorio v1.1.26 Test, 20K Hybrid," the i3-12300 with a score of 72 beats *ALL* the new Ryzen 7xxx CPUs. Can you confirm that please?
I haven't checked any of the other results to your bench but suspect that more might also be different. Also, are efforts underway to update the Bench to include these results, please?
Thank you