Intel Core i9-13900K and i5-13600K Review: Raptor Lake Brings More Bite
by Gavin Bonshor on October 20, 2022 9:00 AM ESTCPU Benchmark Performance: Power And Office
Our previous sets of ‘office’ benchmarks have often been a mix of science and synthetics, so this time we wanted to keep our office section purely on real-world performance. We've also incorporated our power testing into this section too.
The biggest update to our Office-focused tests for 2023 and beyond include UL's Procyon software, which is the successor to PCMark. Procyon benchmarks office performance using Microsoft Office applications, as well as Adobe's Photoshop/Lightroom photo editing software, and Adobe Premier Pro's video editing capabilities. Due to issues with UL Procyon and the video editing test, we haven't been able to properly run these, but once we identify a fix with UL, we will re-test each chip.
We are using DDR5 memory on the Core i9-13900K, the Core i5-13600K, the Ryzen 9 7950X, and Ryzen 5 7600X, as well as Intel's 12th Gen (Alder Lake) processors at the following settings:
- DDR5-5600B CL46 - Intel 13th Gen
- DDR5-5200 CL44 - Ryzen 7000
- DDR5-4800 (B) CL40 - Intel 12th Gen
All other CPUs such as Ryzen 5000 and 3000 were tested at the relevant JEDEC settings as per the processor's individual memory support with DDR4.
Power
The nature of reporting processor power consumption has become, in part, a bit of a nightmare. Historically the peak power consumption of a processor, as purchased, is given by its Thermal Design Power (TDP, or PL1). For many markets, such as embedded processors, that value of TDP still signifies the peak power consumption. For the processors we test at AnandTech, either desktop, notebook, or enterprise, this is not always the case.
Modern high-performance processors implement a feature called Turbo. This allows, usually for a limited time, a processor to go beyond its rated frequency. Exactly how far the processor goes depends on a few factors, such as the Turbo Power Limit (PL2), whether the peak frequency is hard coded, the thermals, and the power delivery. Turbo can sometimes be very aggressive, allowing power values 2.5x above the rated TDP.
AMD and Intel have different definitions for TDP that are, broadly speaking, applied the same. The difference comes from turbo modes, turbo limits, turbo budgets, and how the processors manage that power balance. These topics are 10000-12000 word articles in their own right, and we’ve got a few articles worth reading on the topic.
- Why Intel Processors Draw More Power Than Expected: TDP and Turbo Explained
- Talking TDP, Turbo and Overclocking: An Interview with Intel Fellow Guy Therien
- Reaching for Turbo: Aligning Perception with AMD’s Frequency Metrics
- Intel’s TDP Shenanigans Hurts Everyone
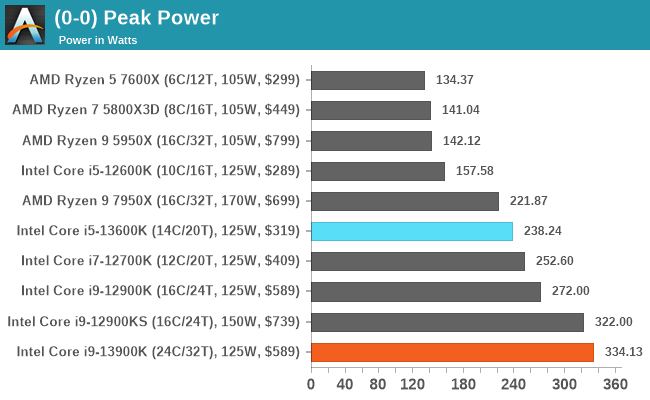
Directly digesting the peak power figures from both the Core i5-13600K and Core i9-13900K processors, the latter drew around 12 W more than the Core i9-12900KS does, and 62 W more than the regular Core i9-12900K. While additional power draw was to be expected due to the very high core clock speeds, let's not forget it is also a 24-core processor, hybrid cores or not.
Even so, the Core i9-13900K drew 32% more power than its 253 W Turbo PL2 limit, but it's very unlikely most users that are gaming or doing general PC stuff will ever see power figures like this. The key to note really with the Core i9-13900K is if it is using this power (125 W TDP to 253 W TDP = 2.02x the power) efficiently for the benefit of performance, then it makes it a less harsh pill to swallow. We would certainly recommend premium cooling with this for maximum performance efficiency.
Looking at the Core i5-13600K, this sits a bit higher than the AMD Ryzen 7950X in terms of peak power consumption, and just below the Core i7-12700K. The Core i5-13600K does draw considerably more power than its predecessor, the Core i5-12600K (157 W versus 238 W), but the increase in both core frequency and double the E-cores, is to be expected.
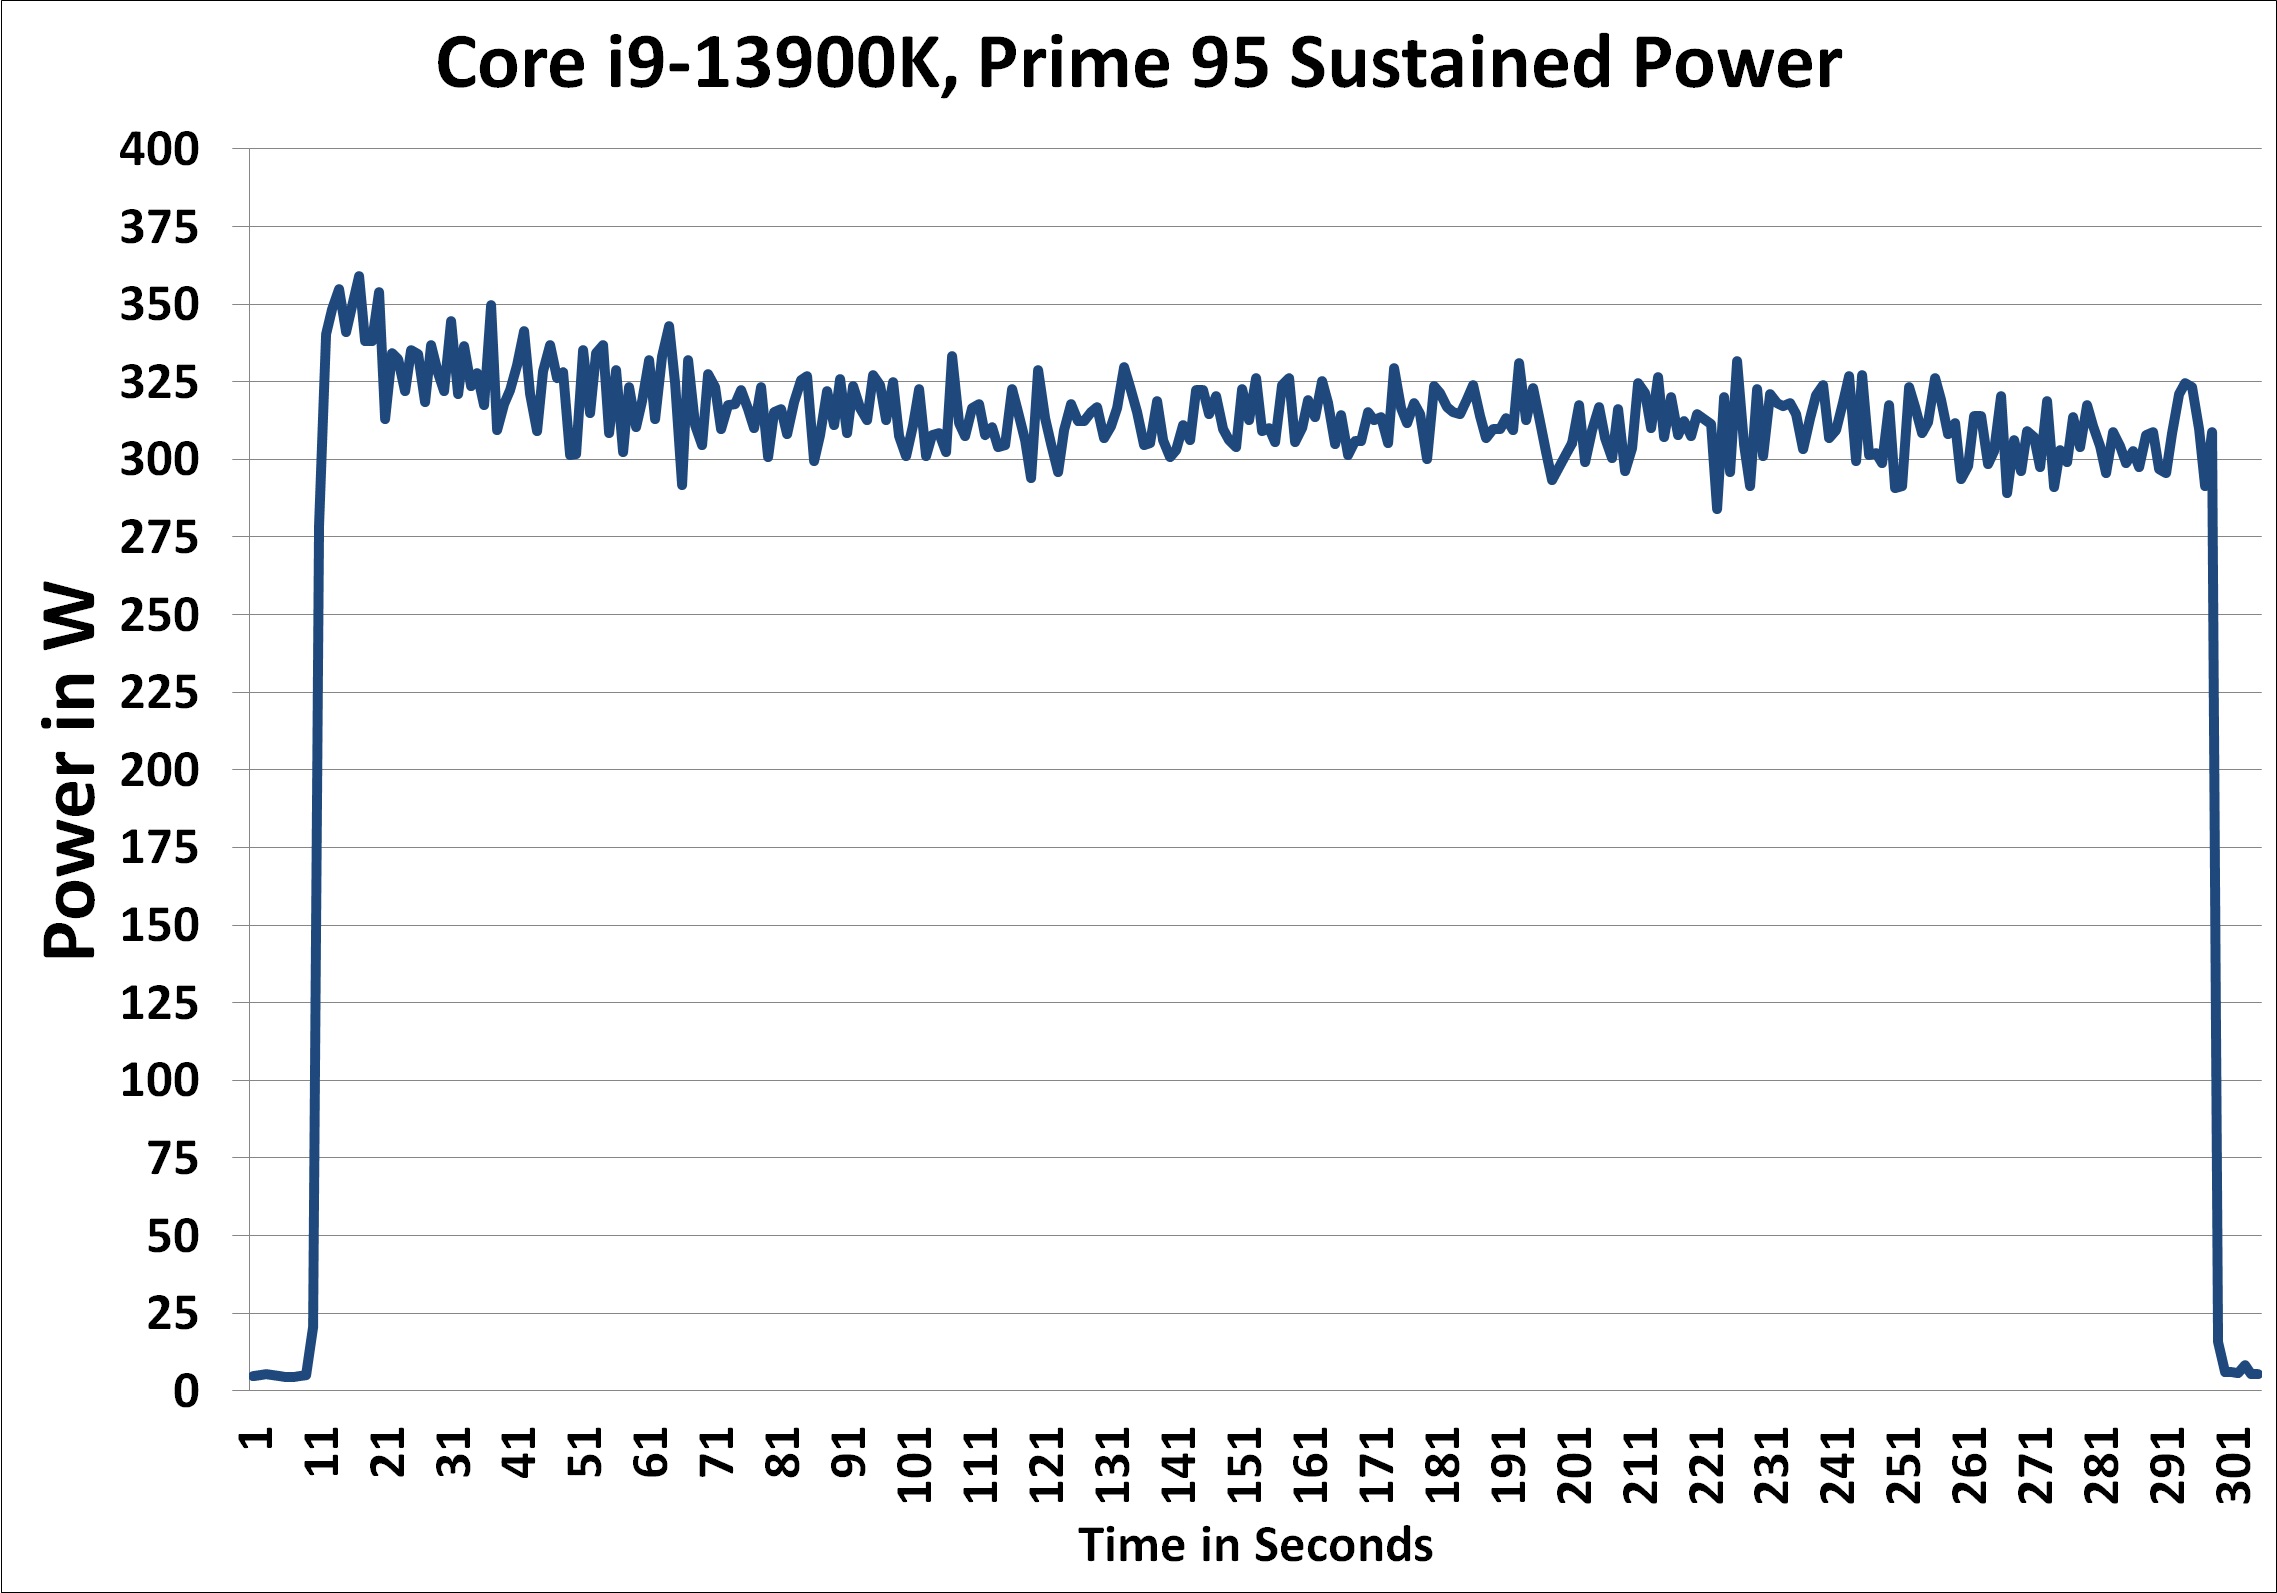
Looking deeper into the high power consumption of the Core i9-13900K, we can see that it is shooting above Intel's PL2 value considerably more than the previous generation. One potential reason for this is down to motherboard vendors continuing to ignore PL2 limits and optimizing for performance under a thermal limit as opposed to power.
During our testing of the AMD Ryzen 9 7950X, we saw our GIGABYTE X670E Aorus Master AM5 motherboard adhere to AMD’s PPT limit, yet with our MSI MPG Z790 Carbon WIFI, we are overshooting the 253 W PL1 limit by around 40-42% at peak figures. While we don’t believe that Intel is ignoring its own classification and specification of power limits here, we believe that the onus is on motherboard vendors to adhere to these limits. A lot of the time, motherboard manufacturers want to deliver the best possible performance out of the box it can, and while we don’t necessarily believe this is a massive negative, it does paint a picture that the Core i9-13900K has insane power draw at maximum load. A power draw that would otherwise be tempered significantly by adhering to PL2.
As we do some additional testing with the MSI MPG Z790 Carbon WIFI, we'll see if this is a specific problem with this particular motherboard, or if it’s the Z790 platform itself. We’ll also look to test some other LGA1700 models we have available, and we’ll update this analysis with our findings.
Office/Web
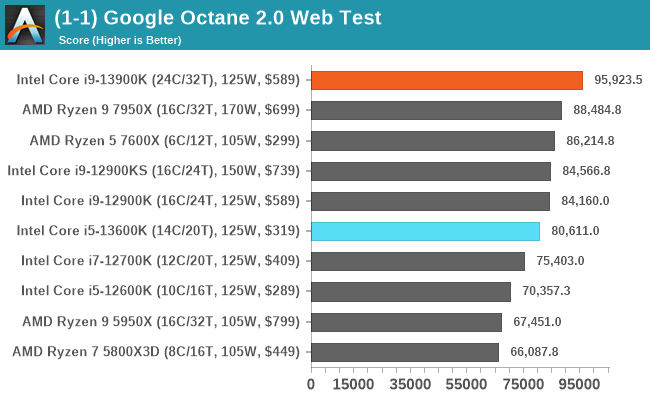
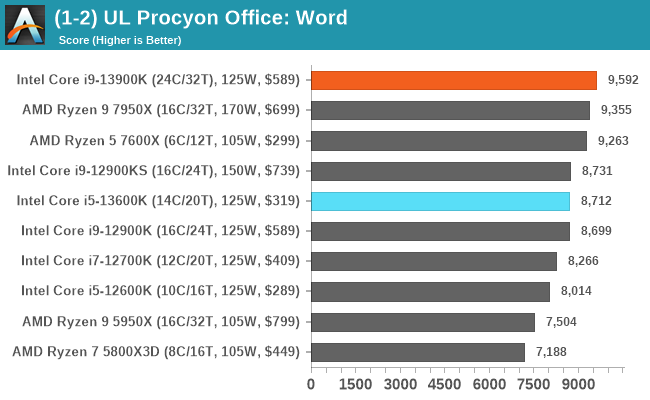
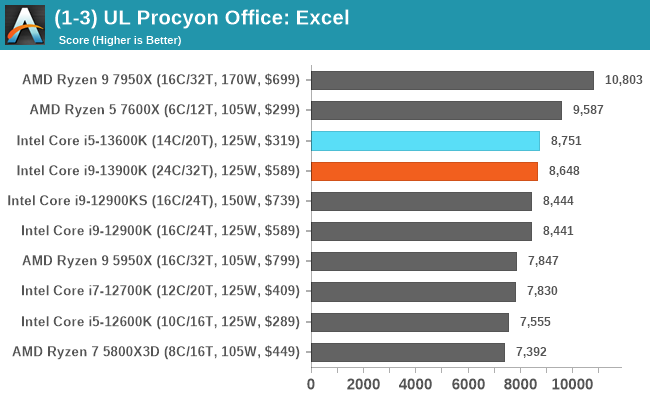
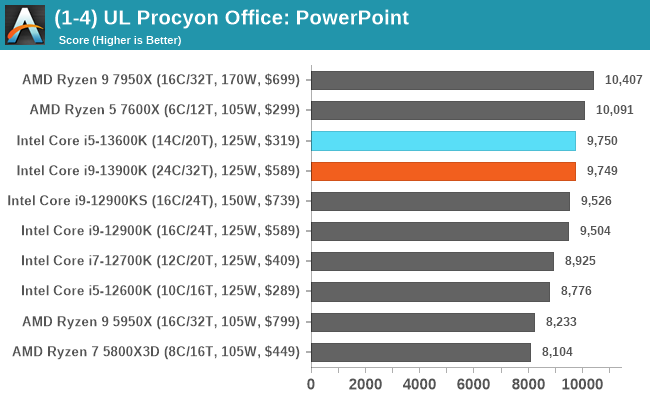
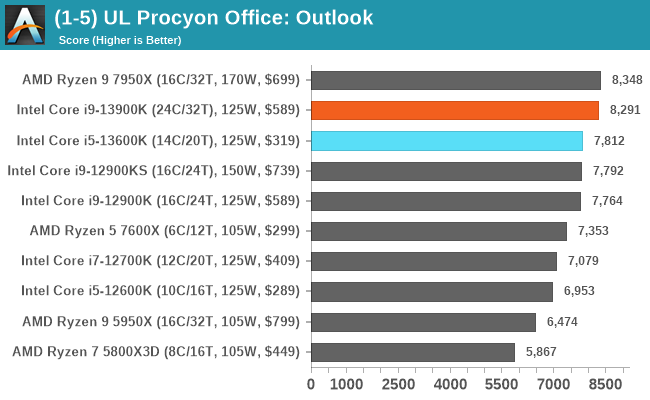
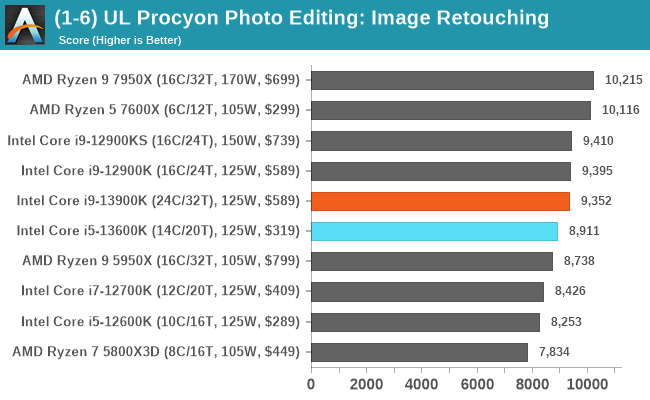

Looking at real-world web and office performance, the Core i9-13900K performs very well, and in a lot of tests, is neck and neck with the Ryzen 9 7950X. This is interesting given the Zen 4 is a new core on a new 5 nm process, and the Intel 13th Gen Core is a refined Intel 7 (10 nm) solution. The Core i5-13600K also performs competitively, and even the previous generation Core i9-12900KS are also in the thick of things.


169 Comments
View All Comments
mode_13h - Friday, October 21, 2022 - link
"The new instruction cache on Gracemont is actually very unique. x86 instruction encoding is all over the place and in the worst (and very rare) case can be as long as 15 bytes long. Pre-decoding an instruction is a costly linear operation and you can’t seek the next instruction before determining the length of the prior one. Gracemont, like Tremont, does not have a micro-op cache like the big cores do, so instructions do have to be decoded each time they are fetched. To assist that process, Gracemont introduced a new on-demand instruction length decoder or OD-ILD for short. The OD-ILD generates pre-decode information which is stored alongside the instruction cache. This allows instructions fetched from the L1$ for the second time to bypass the usual pre-decode stage and save on cycles and power."Source: https://fuse.wikichip.org/news/6102/intels-gracemo... Reply
Sailor23M - Friday, October 21, 2022 - link
Interesting to see Ryzen 5 7600X perform so well in excel/ppt benchmarks. Why is that so? ReplyMakste - Friday, October 21, 2022 - link
Thank you for the review. So Intel too, is finally throwing more cores and increasing frequencies to the problem these days, which increases heat and power usage in turn. AMD too, is a culprit of this practice but has not gone to these lengths as Intel. 16 cores versus supposedly efficiency cores. What is not happening? Replyricebunny - Friday, October 21, 2022 - link
It would be a good idea to highlight that the MT Spec benchmarks are just N instantiations of the single thread test. They are not indicative of parallel computing application performance. There are a few dedicated SPEC benchmarks for parallel performance but for some reason they are never included in Anandtechs benchmarks. ReplyRyan Smith - Friday, October 21, 2022 - link
"There are a few dedicated SPEC benchmarks for parallel performance but for some reason they are never included in Anandtechs benchmarks."They're not part of the actual SPEC CPU suite. I'm assuming you're talking about the SPEC Workstation benchmarks, which are system-level benchmarks and a whole other kettle of fish.
With SPEC, we're primarily after a holistic look at the CPU architecture, and in the rate-N workloads, whether there's enough memory bandwidth and other resources to keep the CPU cores fed. Reply
wolfesteinabhi - Friday, October 21, 2022 - link
its strange to me that when we are talking about value ...especially for budget constraint buyers ... who are also willing to let go of bleeding edge/performance ... we dont even mention AM4 platform.AM4 is still good ..if not great (not to say mature/stable) platform for many ..and you can still buy a lot of reasonably price good procs including 5800X3D ...and users have still chance to upgrade it upto 5950X if they need more cpu at a later date. Reply
cowymtber - Friday, October 21, 2022 - link
Burning hot POS. ReplyBernieW - Friday, October 21, 2022 - link
Disappointed that you didn't spend more time investigating the serious regression for the 13900K vs the 12900K in the 502.gc_r test. The single threaded test does not have the same regression so it's a curious result that could indicate something wrong with the test setup. Alternately, perhaps the 13900K was throttling during that part of the test or maybe E cores are really not good at compiling code. ReplyAvalon - Friday, October 21, 2022 - link
I had that same thought. Why publish something so obviously anomalous and not even say anything about it? Did you try re-testing it? Did you accidentally flip the scores between the 12th and 13th gen? There's no obvious reason this should be happening given the few changes between 12th and 13th gen cores. ReplyRyan Smith - Friday, October 21, 2022 - link
"Disappointed that you didn't spend more time investigating the serious regression for the 13900K vs the 12900K in the 502.gc_r test."We still are. That was flagged earlier this week, and re-runs have produced the same results.
So at this point we're digging into matters a bit more trying to figure out what is going on, as the cause is non-obvious. I'm thinking it may be a thread director hiccup or an issue with the ratio of P and E cores, but there's a lot of different (and weird) ways this could go. Reply