The 2020 Mac Mini Unleashed: Putting Apple Silicon M1 To The Test
by Andrei Frumusanu on November 17, 2020 9:00 AM EST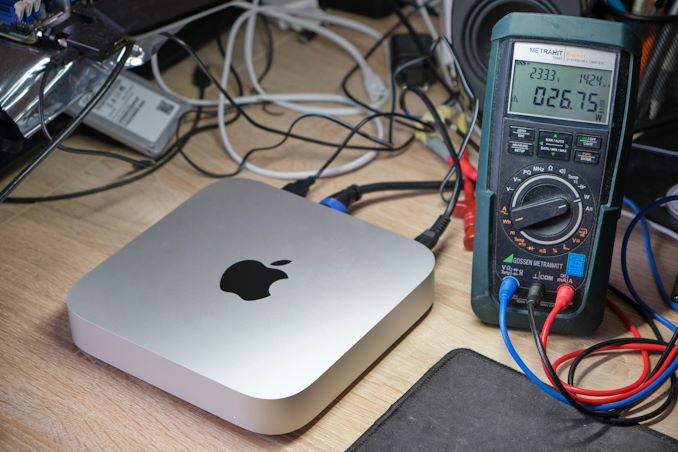
Last week, Apple made industry news by announcing new Mac products based upon the company’s new Apple Silicon M1 SoC chip, marking the first move of a planned 2-year roadmap to transition over from Intel-based x86 CPUs to the company’s own in-house designed microprocessors running on the Arm instruction set.
During the launch we had prepared an extensive article based on the company’s already related Apple A14 chip, found in the new generation iPhone 12 phones. This includes a rather extensive microarchitectural deep-dive into Apple’s new Firestorm cores which power both the A14 as well as the new Apple Silicon M1, I would recommend a read if you haven’t had the opportunity yet:
Since a few days, we’ve been able to get our hands on one of the first Apple Silicon M1 devices: the new Mac mini 2020 edition. While in our analysis article last week we had based our numbers on the A14, this time around we’ve measured the real performance on the actual new higher-power design. We haven’t had much time, but we’ll be bringing you the key datapoints relevant to the new Apple Silicon M1.
Apple Silicon M1: Firestorm cores at 3.2GHz & ~20-24W TDP?
During the launch event, one thing that was in Apple fashion typically missing from the presentation were actual details on the clock frequencies of the design, as well as its TDP which it can sustain at maximum performance.
We can confirm that in single-threaded workloads, Apple’s Firestorm cores now clock in at 3.2GHz, a 6.66% increase over the 3GHz frequency of the Apple A14. As long as there's thermal headroom, this clock also applies to all-core loads, with in addition to 4x 3.2GHz performance cores also seeing 4x Thunder efficiency cores at 2064MHz, also quite a lot higher than 1823MHz on the A14.
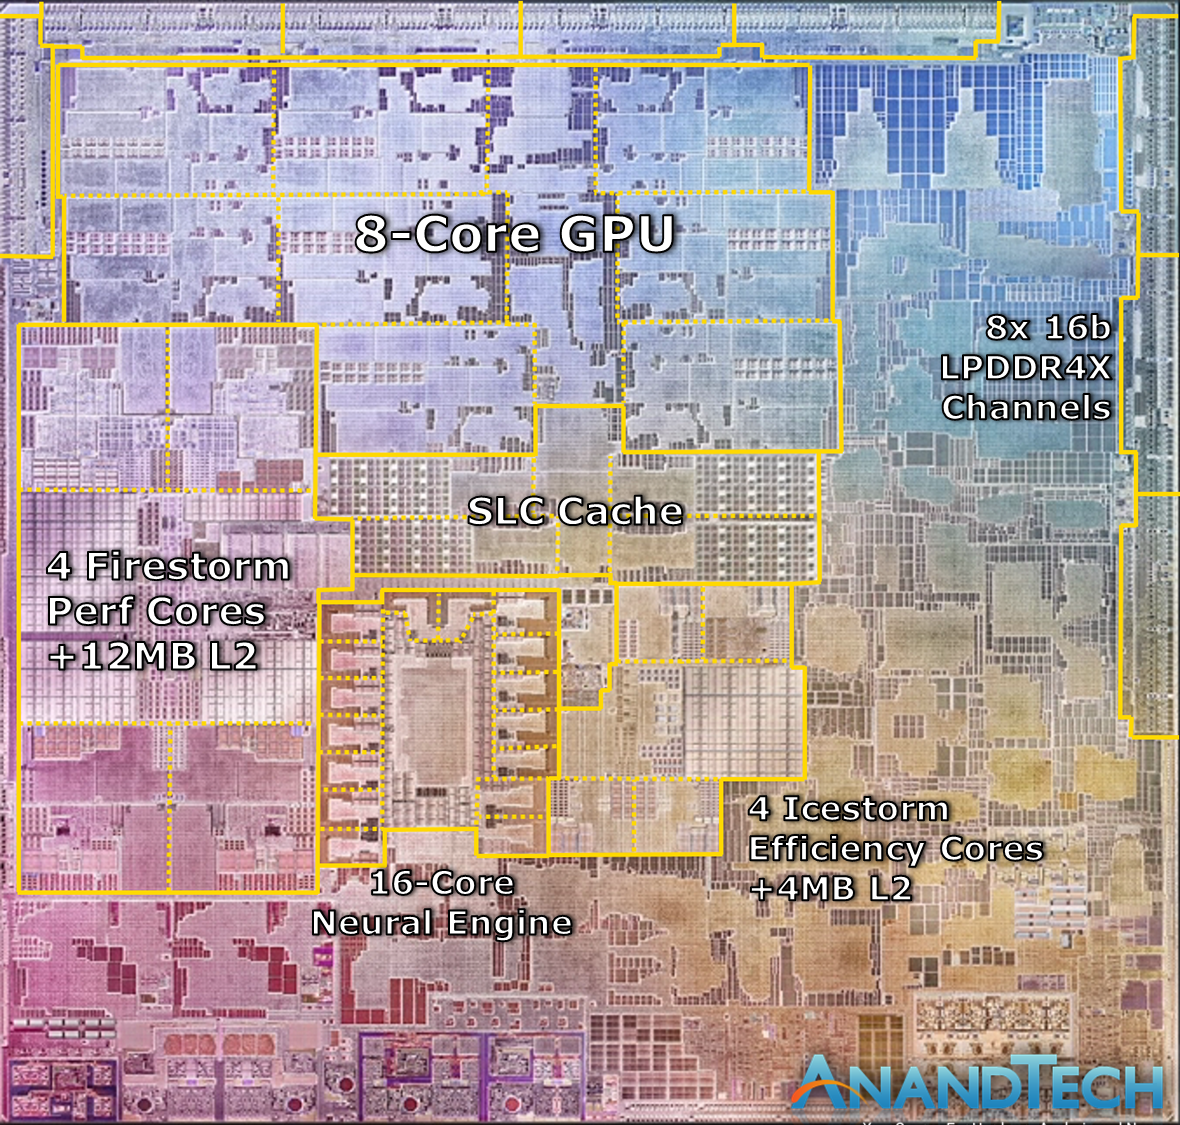
Alongside the four performance Firestorm cores, the M1 also includes four Icestorm cores which are aimed for low idle power and increased power efficiency for battery-powered operation. Both the 4 performance cores and 4 efficiency cores can be active in tandem, meaning that this is an 8-core SoC, although performance throughput across all the cores isn’t identical.
The biggest question during the announcement event was the power consumption of these designs. Apple had presented several charts including performance and power axes, however we lacked comparison data as to come to any proper conclusion.
As we had access to the Mac mini rather than a Macbook, it meant that power measurement was rather simple on the device as we can just hook up a meter to the AC input of the device. It’s to be noted with a huge disclaimer that because we are measuring AC wall power here, the power figures aren’t directly comparable to that of battery-powered devices, as the Mac mini’s power supply will incur a efficiency loss greater than that of other mobile SoCs, as well as TDP figures contemporary vendors such as Intel or AMD publish.
It’s especially important to keep in mind that the figure of what we usually recall as TDP in processors is actually only a subset of the figures presented here, as beyond just the SoC we’re also measuring DRAM and voltage regulation overhead, something which is not included in TDP figures nor your typical package power readout on a laptop.
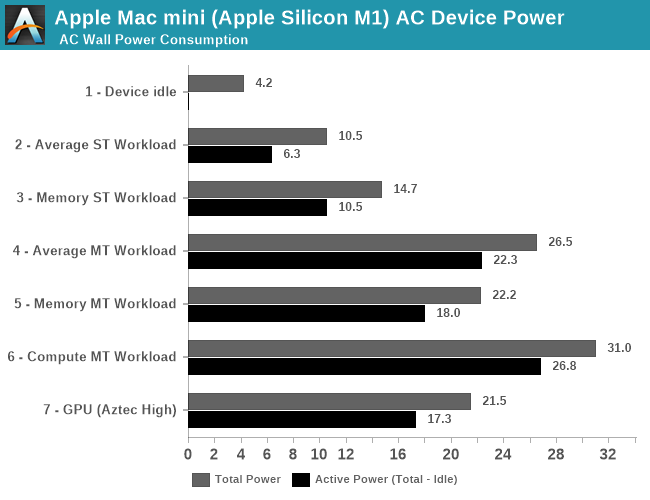
Starting off with an idle Mac mini in its default state while sitting idle when powered on, while connected via HDMI to a 2560p144 monitor, Wi-Fi 6 and a mouse and keyboard, we’re seeing total device power at 4.2W. Given that we’re measuring AC power into the device which can be quite inefficient at low loads, this makes quite a lot of sense and represents an excellent figure.
This idle figure also serves as a baseline for following measurements where we calculate “active power”, meaning our usual methodology of taking total power measured and subtracting the idle power.
During average single-threaded workloads on the 3.2GHz Firestorm cores, such as GCC code compilation, we’re seeing device power go up to 10.5W with active power at around 6.3W. The active power figure is very much in line with what we would expect from a higher-clocked Firestorm core, and is extremely promising for Apple and the M1.
In workloads which are more DRAM heavy and thus incur a larger power penalty on the LPDDR4X-class 128-bit 16GB of DRAM on the Mac mini, we’re seeing active power go up to 10.5W. Already with these figures the new M1 is might impressive and showcases less than a third of the power of a high-end Intel mobile CPU.
In multi-threaded scenarios, power highly depends on the workload. In memory-heavy workloads where the CPU utilisation isn’t as high, we’re seeing 18W active power, going up to around 22W in average workloads, and peaking around 27W in compute heavy workloads. These figures are generally what you’d like to compare to “TDPs” of other platforms, although again to get an apples-to-apples comparison you’d need to further subtract some of the overhead as measured on the Mac mini here – my best guess would be a 20 to 24W range.
Finally, on the part of the GPU, we’re seeing a lower power consumption figure of 17.3W in GFXBench Aztec High. This would contain a larger amount of DRAM power, so the power consumption of Apple’s GPU is definitely extremely low-power, and far less than the peak power that the CPUs can draw.
Memory Differences
Besides the additional cores on the part of the CPUs and GPU, one main performance factor of the M1 that differs from the A14 is the fact that’s it’s running on a 128-bit memory bus rather than the mobile 64-bit bus. Across 8x 16-bit memory channels and at LPDDR4X-4266-class memory, this means the M1 hits a peak of 68.25GB/s memory bandwidth.
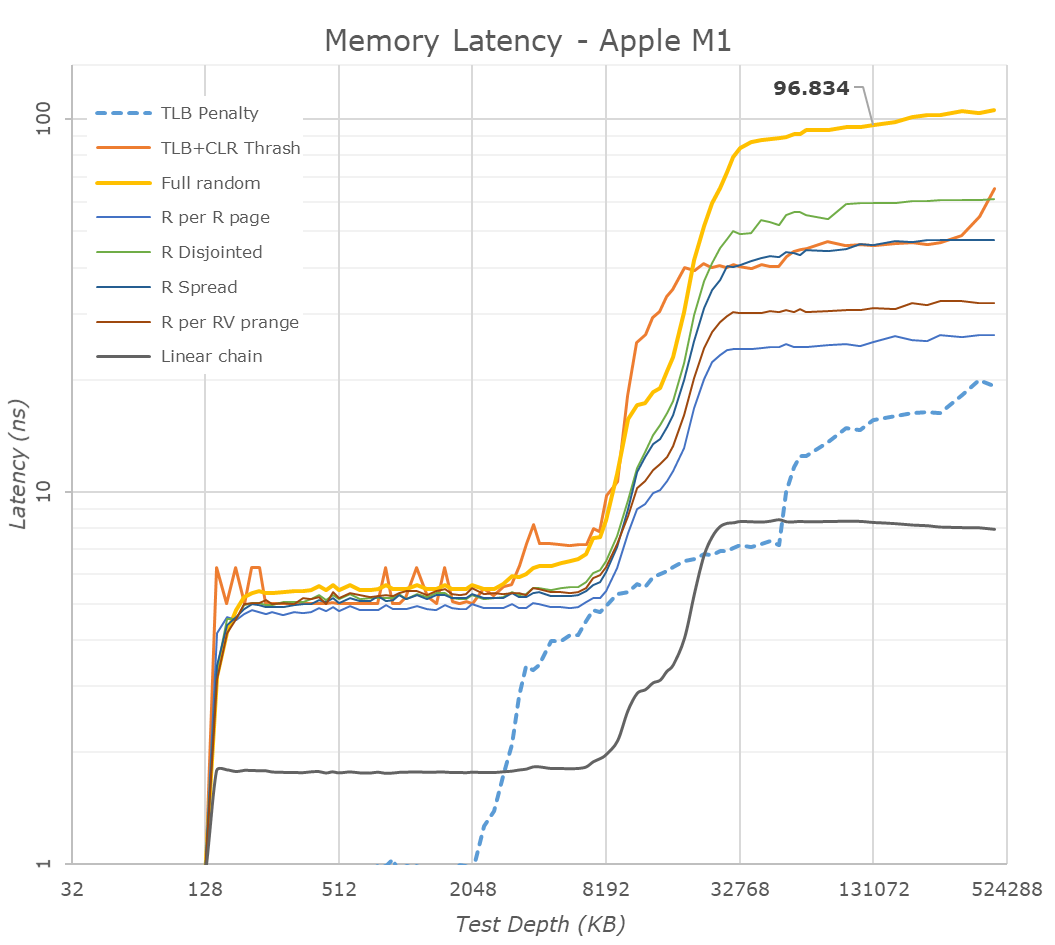
In terms of memory latency, we’re seeing a (rather expected) reduction compared to the A14, measuring 96ns at 128MB full random test depth, compared to 102ns on the A14.
Of further note is the 12MB L2 cache of the performance cores, although here it seems that Apple continues to do some partitioning as to how much as single core can use as we’re still seeing some latency uptick after 8MB.
The M1 also contains a large SLC cache which should be accessible by all IP blocks on the chip. We’re not exactly certain, but the test results do behave a lot like on the A14 and thus we assume this is a similar 16MB chunk of cache on the SoC, as some access patterns extend beyond that of the A14, which makes sense given the larger L2.
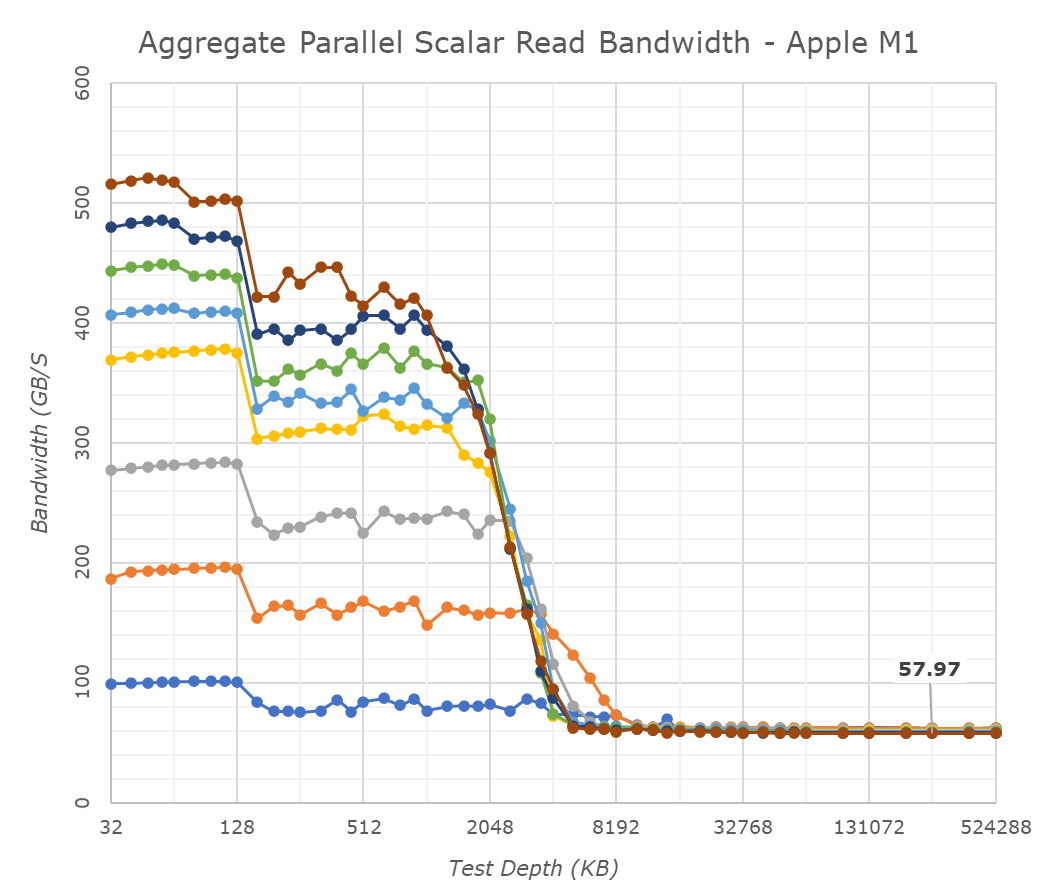
One aspect we’ve never really had the opportunity to test is exactly how good Apple’s cores are in terms of memory bandwidth. Inside of the M1, the results are ground-breaking: A single Firestorm achieves memory reads up to around 58GB/s, with memory writes coming in at 33-36GB/s. Most importantly, memory copies land in at 60 to 62GB/s depending if you’re using scalar or vector instructions. The fact that a single Firestorm core can almost saturate the memory controllers is astounding and something we’ve never seen in a design before.
Because one core is able to make use of almost the whole memory bandwidth, having multiple cores access things at the same time don’t actually increase the system bandwidth, but actually due to congestion lower the effective achieved aggregate bandwidth. Nevertheless, this 59GB/s peak bandwidth of one core is essentially also the speed at which memory copies happen, no matter the amount of active cores in the system, again, a great feat for Apple.
Beyond the clock speed increase, L2 increase, this memory boost is also very likely to help the M1 differentiate its performance beyond that of the A14, and offer up though competition against the x86 incumbents.
- Page 1: Apple Silicon M1: Recap, Power Consumption
- Page 2: Benchmarks: Whatever Is Available
- Page 3: M1 GPU Performance: Integrated King, Discrete Rival
- Page 4: SPEC2006 & 2017: Industry Standard - ST Performance
- Page 5: SPEC2017 - Multi-Core Performance
- Page 6: Rosetta2: x86-64 Translation Performance
- Page 7: Conclusion & First Impressions


682 Comments
View All Comments
Ppietra - Tuesday, November 24, 2020 - link
Sorry, but no! What you showed for the 4800U isn’t the power draw of the computer, it’s the power draw of a processor doing a completely different test in an unnamed computer in unknown settings. Not to mention that this M1 analysis is with a desktop computer not a laptop. Why are you trying to deceive?If you want to see computer power consumption go to Tally Ho Tech youtube channel, you will see how a laptop with the 4800U consumes around 3 times more in Cinebench than a laptop with a M1 chip.
BushLin - Tuesday, November 24, 2020 - link
Oh... I have to wade through some random YouTube channel to see some other flawed comparison? If you can link to an objective test showing actual power draw, post the link.Ppietra - Tuesday, November 24, 2020 - link
hmmm! So you complain about a channel doing a straightforward comparison in similar conditions, but you have no problems in using different kinds of power consumption from completely different tests to validate your "theory". Grand!!For the record thunng8 links shows you the power consumption of the M1 in a Cinebench test done by Anandtech’ author.
BushLin - Tuesday, November 24, 2020 - link
No, I'm continuing to complain that you don't post a link to your evidence, I'm not sitting through every YouTube video of some random when in the next breath you refer again to a forum post linked by thunng8 which is for a different, 4700U CPU.No amount of FUD changes the fact that the M1 is great at single thread, especially for the power but isn't the Jesus CPU you dream it to be in multithreaded workloads.
Put up or shut up.
Ppietra - Tuesday, November 24, 2020 - link
I have said nothing about a 4700U CPU nor referred to links to talk about AMD CPUs. I very clearly only mentioned M1 data when referring to thunng8 links. Neither have I said that the M1 had the highest performance of all, I only talked about power consumption.https://www.youtube.com/watch?v=wuvZQOUDCKY
BushLin - Tuesday, November 24, 2020 - link
Great YouTube video, didn't measure the power draw. Yet you're the one throwing around words like deceive.Ppietra - Tuesday, November 24, 2020 - link
Didn’t measure the power draw? Really?So showing battery level change after 10 minute Cinebench test, with known battery capacities, isn’t sufficient data to determine approximate power draw? Not even enough to give you an idea? A little bit of basic math, then!
16% drop in a 60.7Wh battery gives 9.7Wh of energy use for the AMD laptop. If you prefer in watts, since it was a 10 minute run that gives 58W.
6% drop in a 58Wh battery gives 3.5Wh of energy used for the MacBook Pro. In a 10 minute run that gives 21W, to do the same task.
From a previous video the Cinebench MT scores were 9976 for AMD and 7800 for the MacBook.
If you normalize energy consumption to the Cinebench score, that would mean the MacBook Pro consumes less than half for the same performance!
BushLin - Tuesday, November 24, 2020 - link
What are the cinebench results when running on battery? What is the battery's actual capacity and how fast does it drain when fully loaded? How does the system report battery percentage vs voltage of the cells? How much power does the screen consume? Can you trust the person making the video to be thorough and objective?Could go on and on, or just stick a $15 meter on the AC plug and actually measure it.
Ppietra - Tuesday, November 24, 2020 - link
?? I gave you the Cinebench results. I gave the actual battery capacity, I gave how much it drained when running Cinebench and in what time interval - it is all in the videos!How much power does the screen consume??? REALLY!!!? For someone who argued for the use of "power measurement" "at the wall rather than just the SoC " to now come and argue against measuring the battery power drain in a 10 minutes test it is laughable. Even more so when in the end you make another U turn and just argue about measuring power at the plug - so the screen doesn’t matter now!??
Just face reality M1 power consumption has been measured at 15W in Cinebench, by Anandtech. 4800U power consumption can go higher than 25W since it can be boosted to 35W.
BushLin - Tuesday, November 24, 2020 - link
Since you're either a troll or insane, I'm not going to expend any further effort beyond answering this:"Just face reality M1 power consumption has been measured at 15W in Cinebench, by Anandtech"
With this:
https://images.anandtech.com/graphs/graph16252/119...