Akasa Turing Fanless Case Review: Unrivalled Noiseless NUC
by Ganesh T S on October 26, 2020 8:00 AM ESTBAPCo and UL Benchmarks
The Intel NUC8i5BEB (Akasa Turing) was evaluated using our Fall 2018 test suite for small-form factor PCs. In the first section, we look at BAPCo's SYSmark and various UL benchmarks.
BAPCo SYSmark 2018
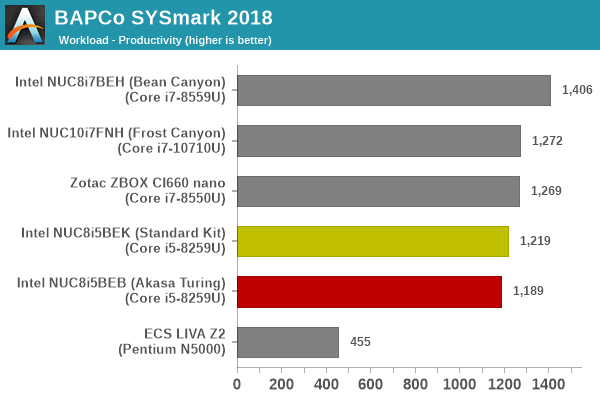
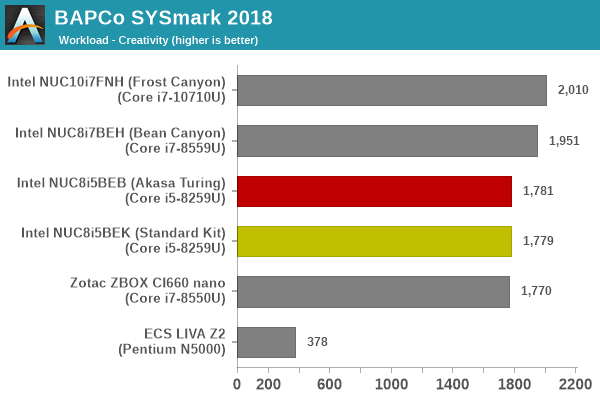
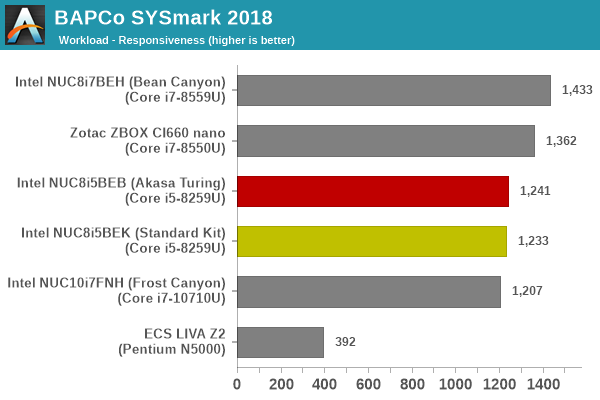
BAPCo's SYSmark 2018 is an application-based benchmark that uses real-world applications to replay usage patterns of business users in the areas of productivity, creativity, and responsiveness. SYSmark 25 was released recently, but the Turing build was benchmarked prior to its release.The 'Productivity Scenario' covers office-centric activities including word processing, spreadsheet usage, financial analysis, software development, application installation, file compression, and e-mail management. The 'Creativity Scenario' represents media-centric activities such as digital photo processing, AI and ML for face recognition in photos and videos for the purpose of content creation, etc. The 'Responsiveness Scenario' evaluates the ability of the system to react in a quick manner to user inputs in areas such as application and file launches, web browsing, and multi-tasking.
Scores are meant to be compared against a reference desktop (the SYSmark 2018 calibration system, a Dell Optiplex 5050 tower with a Core i3-7100 and 4GB of DDR4-2133 memory to go with a 128GB M.2 SATA III SSD). The calibration system scores 1000 in each of the scenarios. A score of, say, 2000, would imply that the system under test is twice as fast as the reference system.
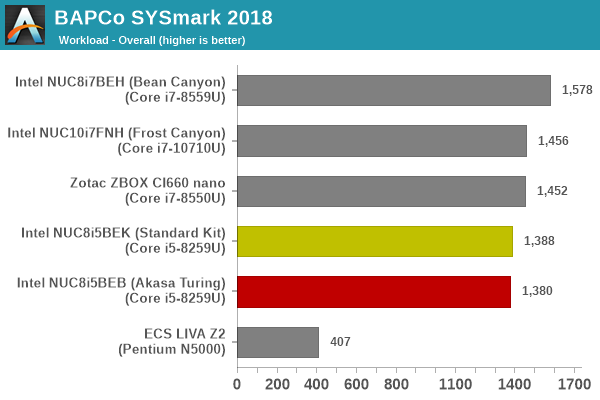
SYSmark 2018 also adds energy measurement to the mix. A high score in the SYSmark benchmarks might be nice to have, but, potential customers also need to determine the balance between power consumption and the efficiency of the system. For example, in the average office scenario, it might not be worth purchasing a noisy and power-hungry PC just because it ends up with a 2000 score in the SYSmark 2014 SE benchmarks. In order to provide a balanced perspective, SYSmark 2018 also allows vendors and decision makers to track the energy consumption during each workload. In the graphs below, we find the total energy consumed by the PC under test for a single iteration of each SYSmark 2018 workload. For reference, the calibration system consumes 5.36 Wh for productivity, 7.71 Wh for creativity, 5.61 Wh for responsiveness, and 18.68 Wh overall.
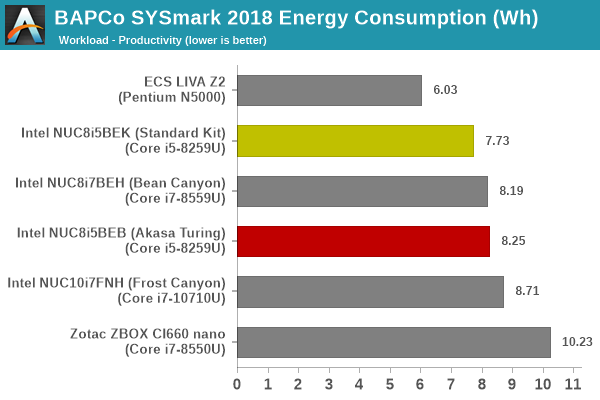
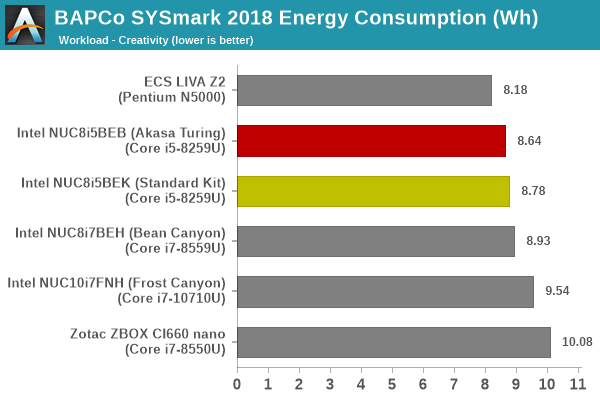
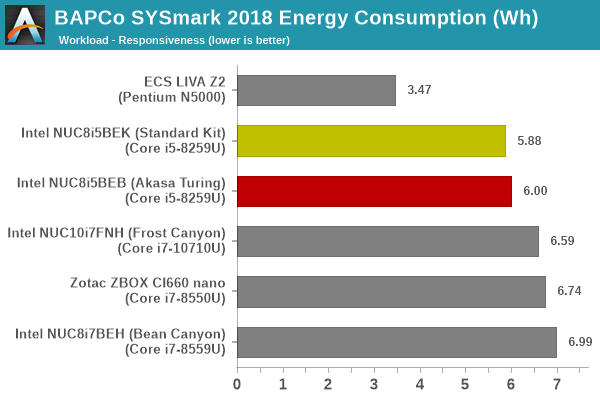
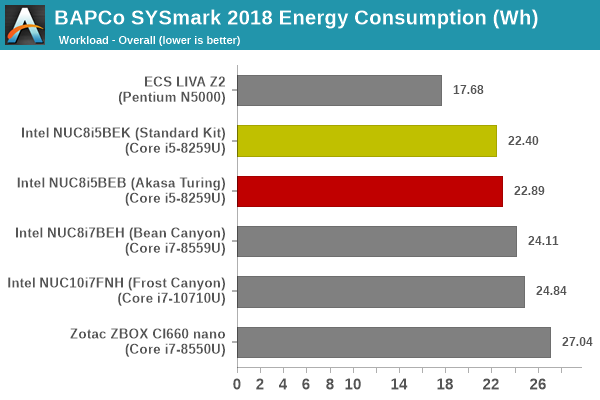
For the most part, the scores of the passively-cooled and actively-cooled versions closely track each other. In the overall energy consumption, we actually see the standard kit being more efficient - in part due to the completion of the tasks in a slightly faster manner for some of the components.
UL Benchmarks - PCMark and 3DMark
This sub-section deals with a selection of the UL Futuremark benchmarks - PCMark 10, PCMark 8, and 3DMark. While the first two evaluate the system as a whole, 3DMark focuses on the graphics capabilities.
PCMark 10
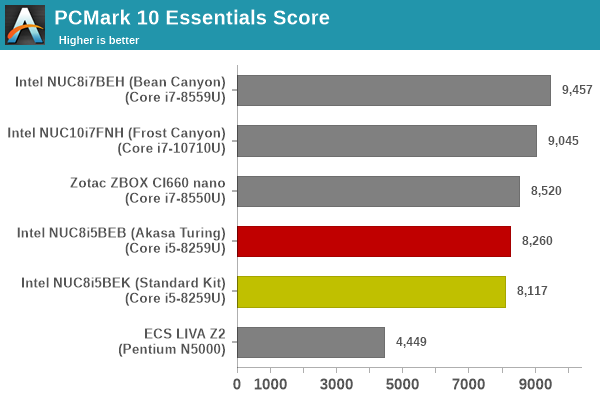
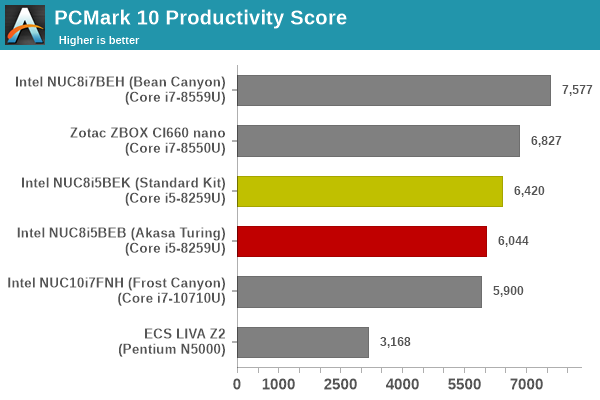
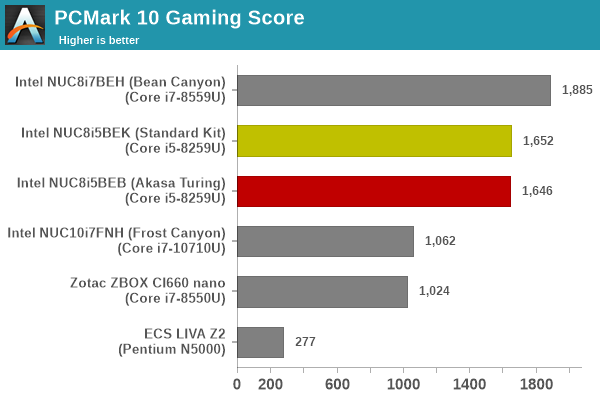
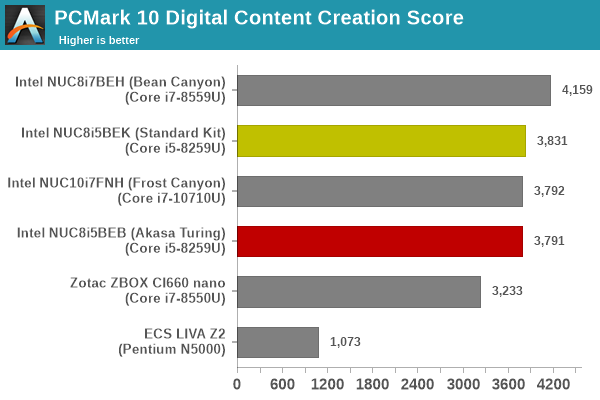
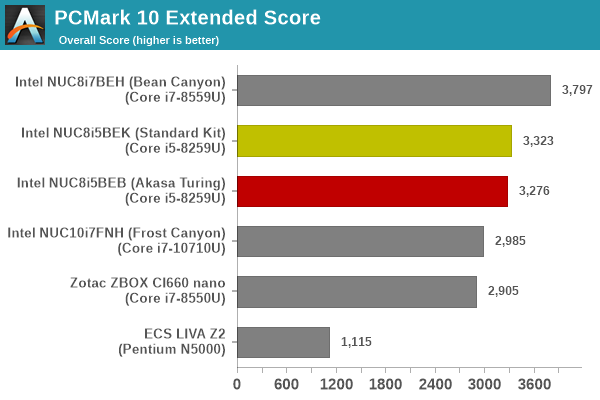
UL's PCMark 10 evaluates computing systems for various usage scenarios (generic / essential tasks such as web browsing and starting up applications, productivity tasks such as editing spreadsheets and documents, gaming, and digital content creation). We benchmarked select PCs with the PCMark 10 Extended profile and recorded the scores for various scenarios. These scores are heavily influenced by the CPU and GPU in the system, though the RAM and storage device also play a part. The power plan was set to Balanced for all the PCs while processing the PCMark 10 benchmark.
PCMark 8
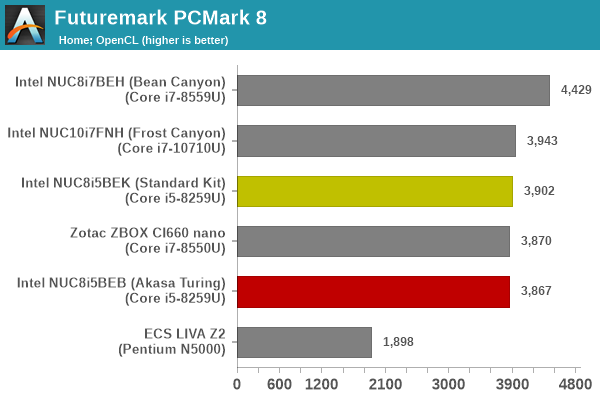
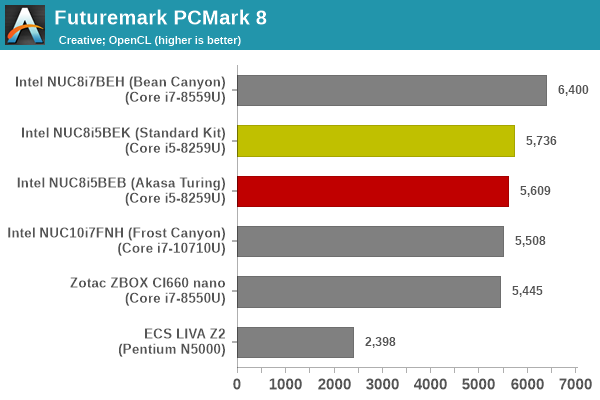
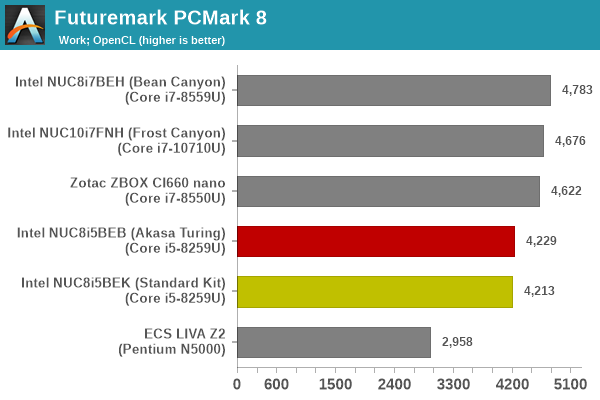
We continue to present PCMark 8 benchmark results (as those have more comparison points) while our PCMark 10 scores database for systems grows in size. PCMark 8 provides various usage scenarios (home, creative and work) and offers ways to benchmark both baseline (CPU-only) as well as OpenCL accelerated (CPU + GPU) performance. We benchmarked select PCs for the OpenCL accelerated performance in all three usage scenarios. These scores are heavily influenced by the CPU in the system. Again, the standard kit and the Turing perform fairly similarly, with the actively-cooled kit getting a slight edge for most components.
3DMark
UL's 3DMark comes with a diverse set of graphics workloads that target different Direct3D feature levels. Correspondingly, the rendering resolutions are also different. We use 3DMark 2.4.4264 to get an idea of the graphics capabilities of the system. In this section, we take a look at the performance of the Intel NUC8i5BEB (Akasa Turing) across the different 3DMark workloads.
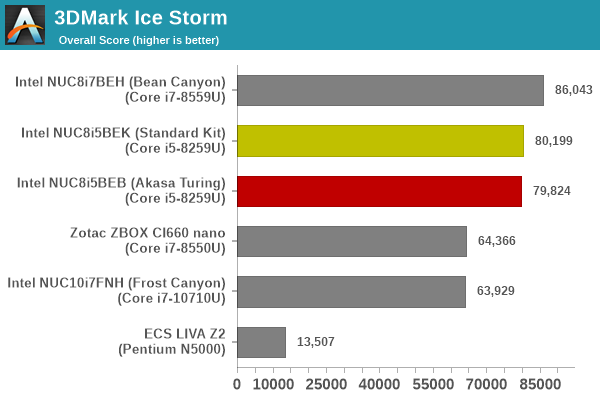
3DMark Ice Storm
This workload has three levels of varying complexity - the vanilla Ice Storm, Ice Storm Unlimited, and Ice Storm Extreme. It is a cross-platform benchmark (which means that the scores can be compared across different tablets and smartphones as well). All three use DirectX 11 (feature level 9) / OpenGL ES 2.0. While the Extreme renders at 1920 x 1080, the other two render at 1280 x 720. The graphs below present the various Ice Storm worloads' numbers for different systems that we have evaluated.
| UL 3DMark - Ice Storm Workloads | |||
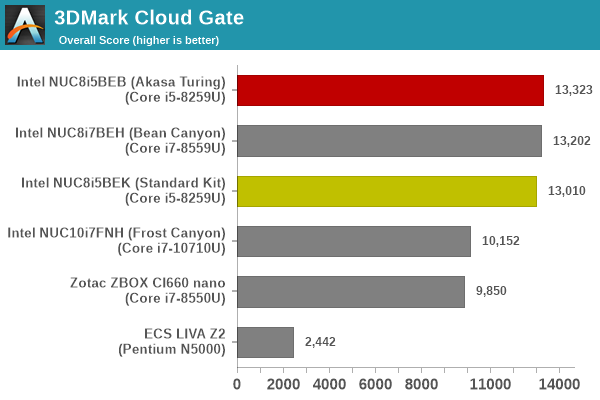
3DMark Cloud Gate
The Cloud Gate workload is meant for notebooks and typical home PCs, and uses DirectX 11 (feature level 10) to render frames at 1280 x 720. The graph below presents the overall score for the workload across all the systems that are being compared.
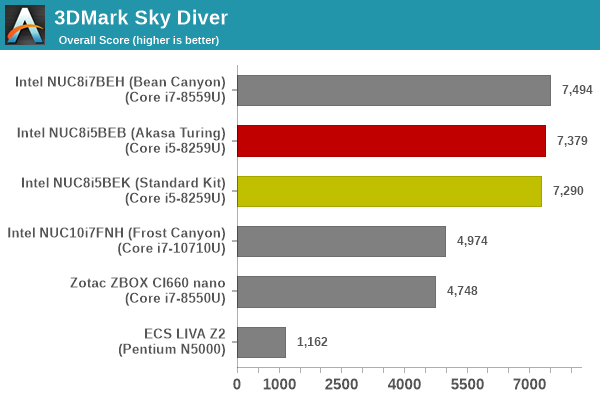
3DMark Sky Diver
The Sky Diver workload is meant for gaming notebooks and mid-range PCs, and uses DirectX 11 (feature level 11) to render frames at 1920 x 1080. The graph below presents the overall score for the workload across all the systems that are being compared.
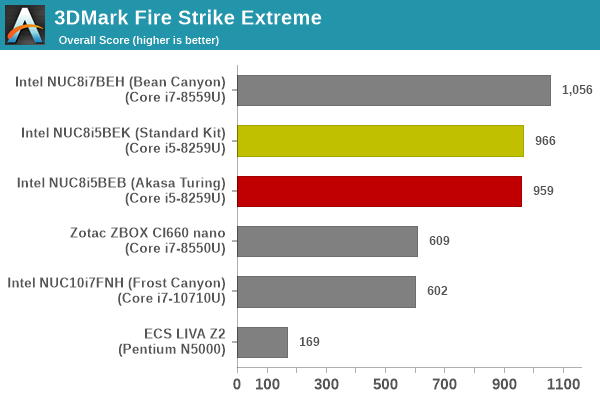
3DMark Fire Strike Extreme
The Fire Strike benchmark has three workloads. The base version is meant for high-performance gaming PCs. Similar to Sky Diver, it uses DirectX 11 (feature level 11) to render frames at 1920 x 1080. The Ultra version targets 4K gaming system, and renders at 3840 x 2160. However, we only deal with the Extreme version in our benchmarking - It renders at 2560 x 1440, and targets multi-GPU systems and overclocked PCs. The graph below presents the overall score for the Fire Strike Extreme benchmark across all the systems that are being compared.
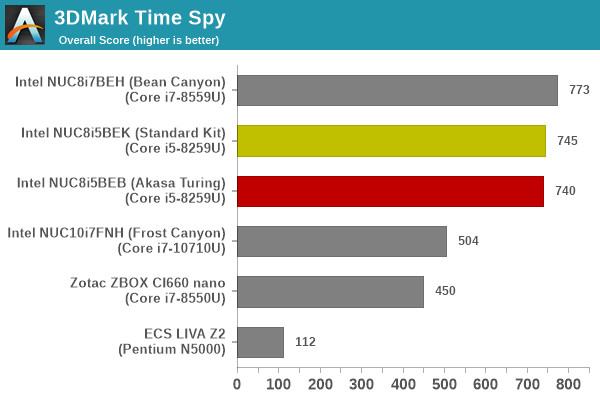
3DMark Time Spy
The Time Spy workload has two levels with different complexities. Both use DirectX 12 (feature level 11). However, the plain version targets high-performance gaming PCs with a 2560 x 1440 render resolution, while the Extreme version renders at 3840 x 2160 resolution. The graphs below present both numbers for all the systems that are being compared in this review.
| UL 3DMark - Time Spy Workloads | |||
3DMark Night Raid
The Night Raid workload is a DirectX 12 benchmark test. It is less demanding than Time Spy, and is optimized for integrated graphics. The graph below presents the overall score in this workload for different system configurations.
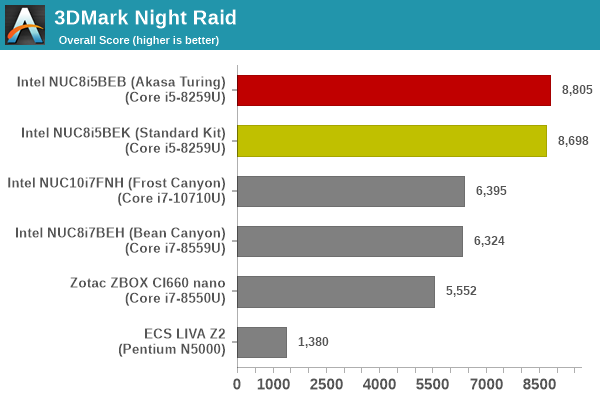
The graphics workloads show more balance - while the actively cooled version has the slight lead in some workloads, the fanless one leads in others. However, the differences across all tests are almost all within the regular run-to-run variance.


28 Comments
View All Comments
Oxford Guy - Monday, October 26, 2020 - link
Fanless, not fabless. Apple’s ‘auto-defect’ at its finest.eastcoast_pete - Monday, October 26, 2020 - link
Google's Gboard is no slouch at those, either. Smart keyboards can be so dumb sometimes (:Spunjji - Wednesday, October 28, 2020 - link
You should check out monsterlabo - they'd had fanless CPU+GPU options available commercially for a while now, and The Beast looks like it will provide as much cooling as anyone could reasonably need.BushLin - Monday, October 26, 2020 - link
Every Akasa cooling product I've encountered has performed worse than stock so kudos to them for not stinking the place out with this particular product.Flunk - Tuesday, October 27, 2020 - link
Considering it's an entirely custom, fanless cooled case for a NUC. This thing is surprisingly affordable. There are a lot of commercial and industrial applications for a case like this.asfletch - Tuesday, October 27, 2020 - link
Good to see fanless tech getting some attention. I'm one of those fussy tinnitus sufferers, and the silent PC I just built for myself is making me very happy.However, my case (Streacom FC8a) is also 2.7kg net, yet it is coping fine with a 65w Core i5, even in high Australian ambient temps. Same weight and seemingly awkward form factor for the Akasa makes me appreciate mine even more.
Spunjji - Wednesday, October 28, 2020 - link
Those Streacom cases are excellent. One day I'd like to build an APU-based system in the DB4, maybe once AMD get around to sliding RDNA 2 into a DDR5-based system.asfletch - Wednesday, October 28, 2020 - link
Yeah I was keen to use Ryzen 4650G but couldn't find one in my neck of the woods. Maybe next upgrade in a few years when the integrated graphics are even more impressive.