The Noctua NH-U12A CPU Cooler Review: Big Performance in a Small Space
by E. Fylladitakis on July 11, 2019 12:30 PM EST- Posted in
- Cases/Cooling/PSUs
- Noctua
- CPU cooler
Testing Methodology
Although the testing of a cooler appears to be a simple task, that could not be much further from the truth. Proper thermal testing cannot be performed with a cooler mounted on a single chip, for multiple reasons. Some of these reasons include the instability of the thermal load and the inability to fully control and or monitor it, as well as the inaccuracy of the chip-integrated sensors. It is also impossible to compare results taken on different chips, let alone entirely different systems, which is a great problem when testing computer coolers, as the hardware changes every several months. Finally, testing a cooler on a typical system prevents the tester from assessing the most vital characteristic of a cooler, its absolute thermal resistance.
The absolute thermal resistance defines the absolute performance of a heatsink by indicating the temperature rise per unit of power, in our case in degrees Celsius per Watt (°C/W). In layman's terms, if the thermal resistance of a heatsink is known, the user can assess the highest possible temperature rise of a chip over ambient by simply multiplying the maximum thermal design power (TDP) rating of the chip with it. Extracting the absolute thermal resistance of a cooler however is no simple task, as the load has to be perfectly even, steady and variable, as the thermal resistance also varies depending on the magnitude of the thermal load. Therefore, even if it would be possible to assess the thermal resistance of a cooler while it is mounted on a working chip, it would not suffice, as a large change of the thermal load can yield much different results.
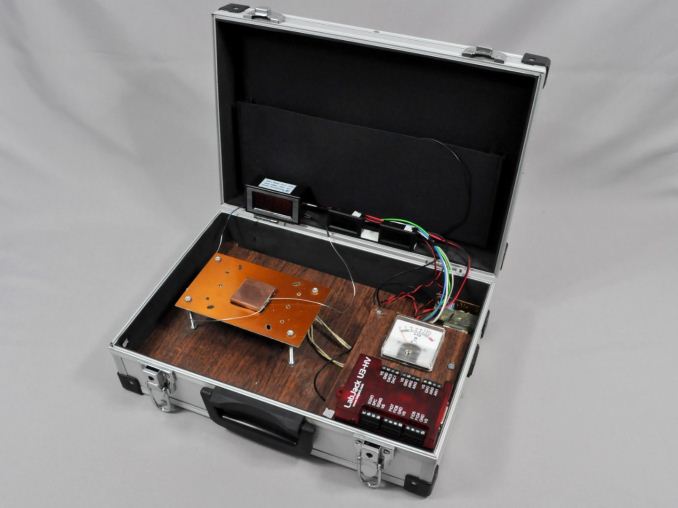
Appropriate thermal testing requires the creation of a proper testing station and the use of laboratory-grade equipment. Therefore, we created a thermal testing platform with a fully controllable thermal energy source that may be used to test any kind of cooler, regardless of its design and or compatibility. The thermal cartridge inside the core of our testing station can have its power adjusted between 60 W and 340 W, in 2 W increments (and it never throttles). Furthermore, monitoring and logging of the testing process via software minimizes the possibility of human errors during testing. A multifunction data acquisition module (DAQ) is responsible for the automatic or the manual control of the testing equipment, the acquisition of the ambient and the in-core temperatures via PT100 sensors, the logging of the test results and the mathematical extraction of performance figures.
Finally, as noise measurements are a bit tricky, their measurement is being performed only manually. Fans can have significant variations in speed from their rated values, thus their actual speed during the thermal testing is being acquired via a laser tachometer. The fans (and pumps, when applicable) are being powered via an adjustable, fanless desktop DC power supply and noise measurements are being taken 1 meter away from the cooler, in a straight line ahead from its fan engine. At this point we should also note that the Decibel scale is logarithmic, which means that roughly every 3 dB(A) the sound pressure doubles. Therefore, the difference of sound pressure between 30 dB(A) and 60 dB(A) is not "twice as much" but nearly a thousand times greater. The table below should help you cross-reference our test results with real-life situations.
The noise floor of our recording equipment is 30.2-30.4 dB(A), which represents a medium-sized room without any active noise sources. All of our acoustic testing takes place during night hours, minimizing the possibility of external disruptions.
| <35dB(A) | Virtually inaudible |
| 35-38dB(A) | Very quiet (whisper-slight humming) |
| 38-40dB(A) | Quiet (relatively comfortable - humming) |
| 40-44dB(A) | Normal (humming noise, above comfortable for a large % of users) |
| 44-47dB(A)* | Loud* (strong aerodynamic noise) |
| 47-50dB(A) | Very loud (strong whining noise) |
| 50-54dB(A) | Extremely loud (painfully distracting for the vast majority of users) |
| >54dB(A) | Intolerable for home/office use, special applications only. |
*noise levels above this are not suggested for daily use


68 Comments
View All Comments
beginning - Saturday, July 13, 2019 - link
Thank you for the article. Lives up to the level of scientific rigor that anandtech has gotten me used to. This is very helpful and the graph of average thermal resistance at 12V will be a part of my go-to reference materials. I would like to request a similar graph for AIO liquid coolers if possible. Thank you once again for this in-depth article.Showtime - Saturday, July 13, 2019 - link
So funny reading people justifying the pricing. I think Noctua has gotten a little full of themselves. Unless this 120mm cooler equals the D15, $100 is silly. Too many options that will fit that space for half the cost.Orange_Swan - Sunday, July 14, 2019 - link
I love Noctua’s performance, but I really hate their color choice.Surfacround - Monday, July 15, 2019 - link
great, the be quiet! dark rock pro 3 is not available, and it is a copy of the noctua cooler... no wonder it beats the noctua cooler. moot point.max347 - Wednesday, July 31, 2019 - link
Ah good, I was hoping to find a review of the new Ultra 120 TRUE....oh wait...