Zen and Vega DDR4 Memory Scaling on AMD's APUs
by Gavin Bonshor on June 28, 2018 9:00 AM EST- Posted in
- CPUs
- Memory
- G.Skill
- AMD
- DDR4
- DRAM
- APU
- Ryzen
- Raven Ridge
- Scaling
- Ryzen 3 2200G
- Ryzen 5 2400G
CPU Performance
Rendering - Blender 2.78: link
For a render that has been around for what seems like ages, Blender is still a highly popular tool. We managed to wrap up a standard workload into the February 5 nightly build of Blender and measure the time it takes to render the first frame of the scene. Being one of the bigger open source tools out there, it means both AMD and Intel work actively to help improve the codebase, for better or for worse on their own/each other's microarchitecture.
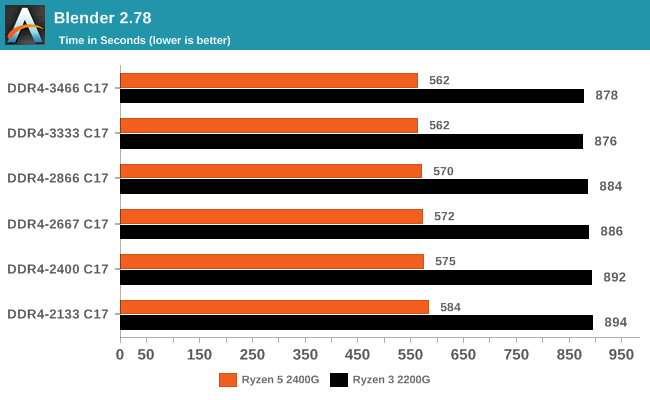
While memory speed does influence our final rendering duration consistently by shaving seconds off, the jump from DDR4-2133 to DDR4-3333 equates to a 2% reduction overall on the Ryzen 3 2200G, although the last step from 3333 to 3466 is actually a regression. The Ryzen 5 2400G experienced a reduction of just under 4%.
Rendering – POV-Ray 3.7: link
The Persistence of Vision Ray Tracer, or POV-Ray, is a freeware package for as the name suggests, ray tracing. It is a pure renderer, rather than modeling software, but the latest beta version contains a handy benchmark for stressing all processing threads on a platform. We have been using this test in motherboard reviews to test memory stability at various CPU speeds to good effect – if it passes the test, the IMC in the CPU is stable for a given CPU speed. As a CPU test, it runs for approximately 1-2 minutes on high-end platforms.
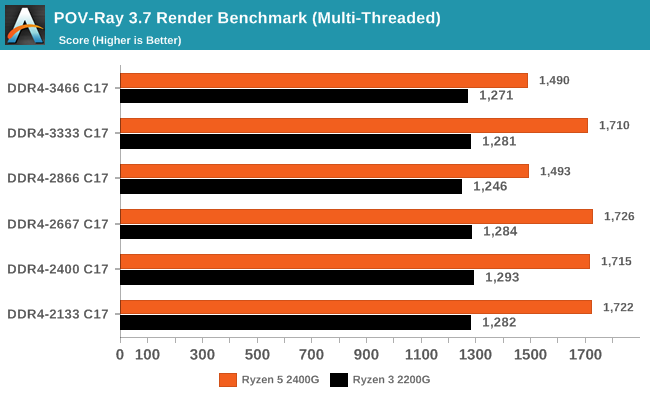
Our results in POV-Ray 3.7 were a little hit and miss and showed irregularities at different memory clock speeds, perhaps due to the additional power required by the memory controller at higher frequencies taking away from available CPU power. This means POV-Ray isn’t really influenced more by the memory speeds themselves, although it is certainly more determined from more CPU cores and higher frequencies as the difference between the 2200G and 2400G show.
WinRAR 5.4: link
Our WinRAR test from 2013 is updated to the latest version of WinRAR at the start of 2014. We compress a set of 2867 files across 320 folders totaling 1.52 GB in size – 95% of these files are small typical website files, and the rest (90% of the size) are small 30-second 720p videos.
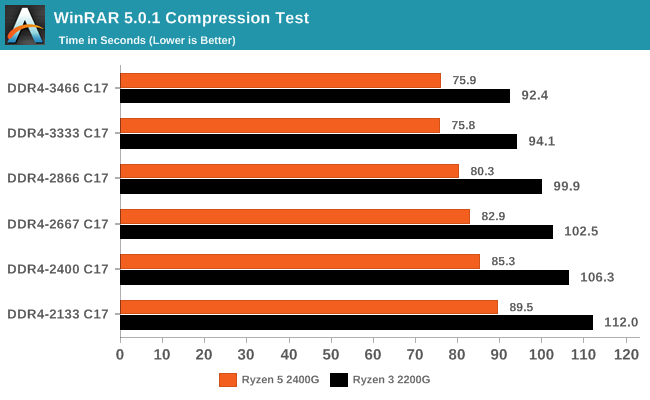
As the memory frequency was increased, the compression time was consistently lower going up a memory strap. With WinRAR being one of our most DRAM-affected CPU tests, we have seen this before with other CPU generations. The 2200G saw a 21% increase in throughput, while the 2400G had a +18% gain. However it is worth noting that the DDR4-3466 time was slightly slower than that of the DDR4-3333 time again.
7-Zip 9.2: link
As an open source compression tool, 7-Zip is a popular tool for making sets of files easier to handle and transfer. The software offers up its own benchmark, to which we report the result.
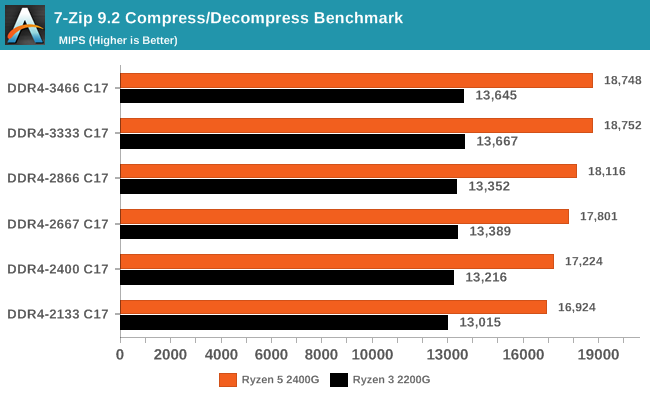
The 7-Zip results are interesting as with both Ryzen based APUs at the DDR4-3333 setting saw the biggest benefit in compression and decompressing. Again, the top strap in our testing was not the most performant. Overall gains were +11% for the 2400G, and +5% for the 2200G, in line with thread counts.
Point Calculations – 3D Movement Algorithm Test: link
3DPM is a self-penned benchmark, taking basic 3D movement algorithms used in Brownian Motion simulations and testing them for speed. High floating point performance, MHz, and IPC win in the single thread version, whereas the multithread version has to handle the threads and loves more cores. For a brief explanation of the platform agnostic coding behind this benchmark, see my forum post here.
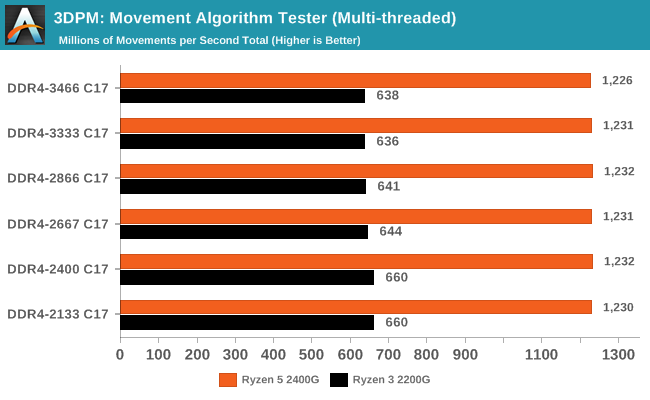
With our 3DPM Brownian Motion simulator benchmark, memory frequency made little difference in increasing performance, although as our results show, the slower the memory, the better performance we experienced on the Ryzen 3 2200G. The Ryzen 2400G experienced a similar range of inconsistent and inconsequential results showing little to no improvement as the memory strap was increased.
Neuron Simulation - DigiCortex v1.20: link
The newest benchmark in our suite is DigiCortex, a simulation of biologically plausible neural network circuits, and simulates activity of neurons and synapses. DigiCortex relies heavily on a mix of DRAM speed and computational throughput, indicating that systems which apply memory profiles properly should benefit and those that play fast and loose with overclocking settings might get some extra speed up. Results are taken during the steady state period in a 32k neuron simulation and represented as a function of the ability to simulate in real time (1.000x equals real-time).
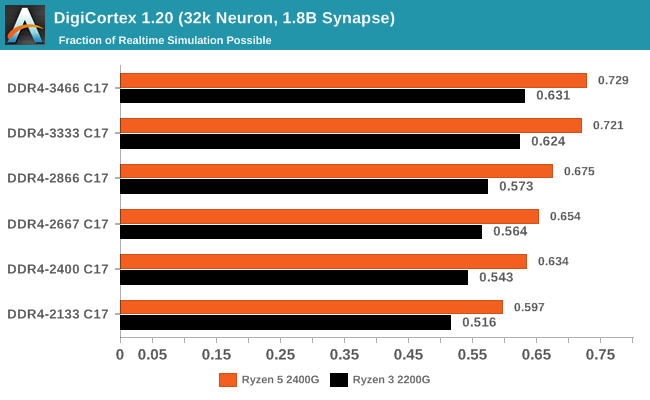
DigiCortex experienced a very subsequent increase throughout the tested memory straps on both the Ryzen APUs, with a nice jump in performance of 22% on the 2200G and on the 2400G.


74 Comments
View All Comments
BedfordTim - Thursday, June 28, 2018 - link
To illustrate your point, even the cheapest DDR4 2133 memory is CL15JasonMZW20 - Thursday, June 28, 2018 - link
I think it's better to have the same timings as a testing reference. Yes, typically memory latencies are lower with lower clockspeeds, but really, AT are testing for memory bandwidth limitations and performance increases associated with increased memory bandwidth alone (not factoring latencies, since they're static across the range). In that sense, it's a successful test.There is a bit of performance left out for lower clockspeed kits, but that's outside the scope of this test which singled out bandwidth only.
FullmetalTitan - Thursday, June 28, 2018 - link
Seems like an effective control to me, pretty standard experimental control.This was clearly not a real-world testing scenario, but rather an artificial one where they fixed a common variable (CAS latency) in order to highlight the direct correlation of mem frequency to GPU performance. Anyone interested in this type of information should understand that these tests are very much NOT a real-world scenario.
Lonyo - Thursday, June 28, 2018 - link
They fixed the variable but didn't fix it. Fixing the CAS cycles doesn't fix the CAS delay. Adjusting the CAS cycles would provide a set CAS delay. The latency is measured in cycles, but faster RAM has faster cycles so the time-based latency decreases with the same CAS setting.e.g. 2000MHz CAS 10 has the same ns latency as 4000MHz CAS20.
DDR4-3466 at 17 CAS is 9.81s latency. DDR4-2133 at 12 CAS would be 11.26. At 17 it's 15.95ns.
Intel's XMP profiles for 2133MHz go from 9 to 13ns. For 3466MHz it's 16 or 18. 8.44ns vs 9.23ns.
If the increase in framerate is partly due to changes in latency (99th percentile may well be), then this test isn't reflective of real world performance with reasonable variables.
gglaw - Saturday, June 30, 2018 - link
This test was definitely very flawed and misleading for most average computer users. Most techies can read into the details and understand it was purely a demonstration of what happens when you lock the same timings and increase only the frequency of the RAM, but many will feel that this is an indirect review of how different memory kits perform. The reality is that the cheaper, low frequency kits are a lot closer to the high-end ones than the graphs show. A much better review would include both comparisons with and without locked timings, and if not including the real world part where the timings are also varied it should be noted in bold multiple times, perhaps even as a disclaimer below every chart. "These graphs do not demonstrate real world performance of the memory kits as they were not allowed to operate at the recommended timings." (That the huge majority of users would let them run at.)You go as far as making purchasing recommendations further indicating that the performance displayed in your charts are indicative of specific product reviews and finding a sweet spot for price/performance. This is the most flawed part. You neutered the very popular 2133-2400 segment by exaggerating how much faster the 3000+ kits are. If you allowed the lower frequencies to operate at their recommended/default timings, the price/performance recommendations would be entirely different.
mode_13h - Thursday, June 28, 2018 - link
I agree with this, but I do see value in a set of tests which varied only clock speed.What I was thinking they should've done was a second set of tests at the lowest latency usable with each speed. Now, that would lend real-world applicability you want *and* show the impact of memory latency.
peevee - Tuesday, July 3, 2018 - link
They actually VARIED the latencies, as measured properly, in time. They artificially forced longer latencies when running memory on lower frequencies. That is the problem. Maybe they have memory advertisers. Or it was gross incompetence.peevee - Thursday, June 28, 2018 - link
" specifically up to version 1.0.0.6, but now preceded by 1.1.0.1."You mean "superseded"?
.vodka - Thursday, June 28, 2018 - link
No. AGESA version number got reset after Raven Ridge's. Pinnacle's is back to 1.0.0.x.This is why tools report SummitPI/RavenPI/PinnaclePI and the version number. One without the other is a recipe for confusion.
mooninite - Thursday, June 28, 2018 - link
This has really made me reconsider a 2200G instead of a 2400G for my HTPC. The 2200G is currently $99 vs $160 for the 2400G. Why pay $60 more for ~2-4 more FPS?